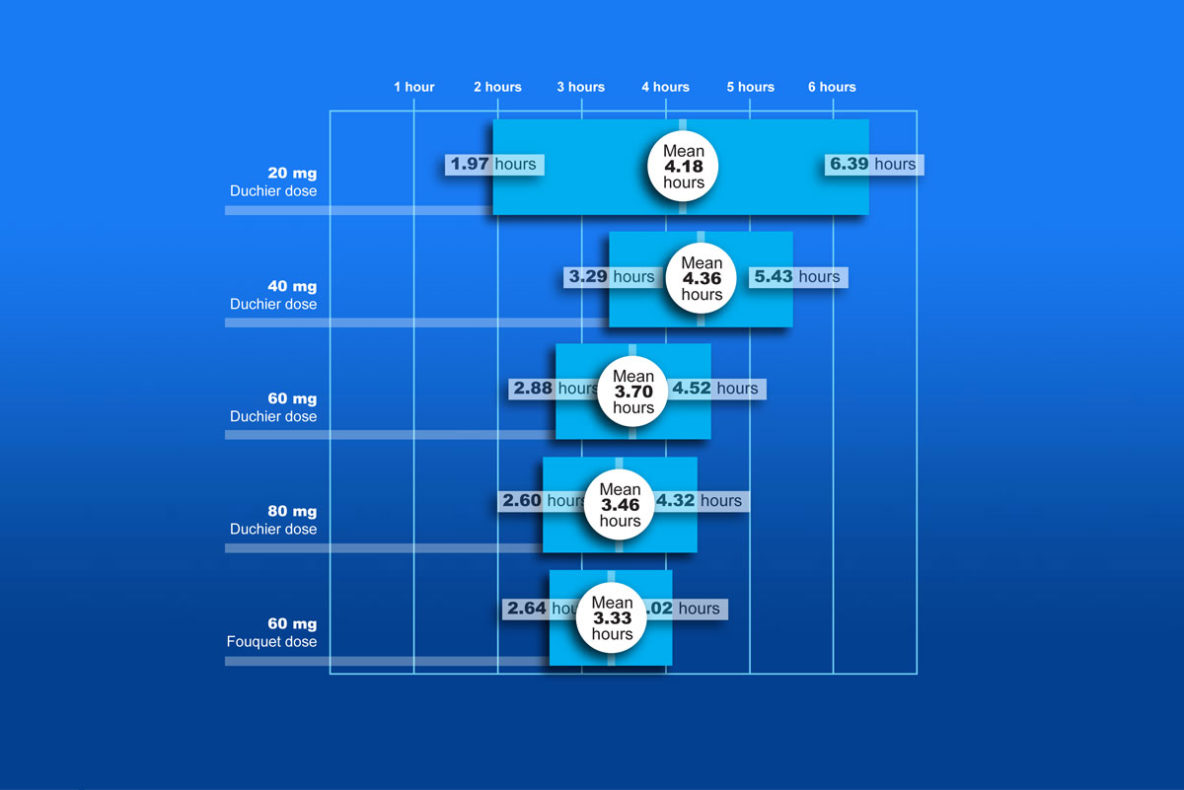
Once the mean similarities are placed along-side the dose and duration information, one can see the different contributing factors affecting the results.
GRAPHIC #6

Once the mean similarities are placed along-side the dose and duration information, one can see the different contributing factors affecting the results.