
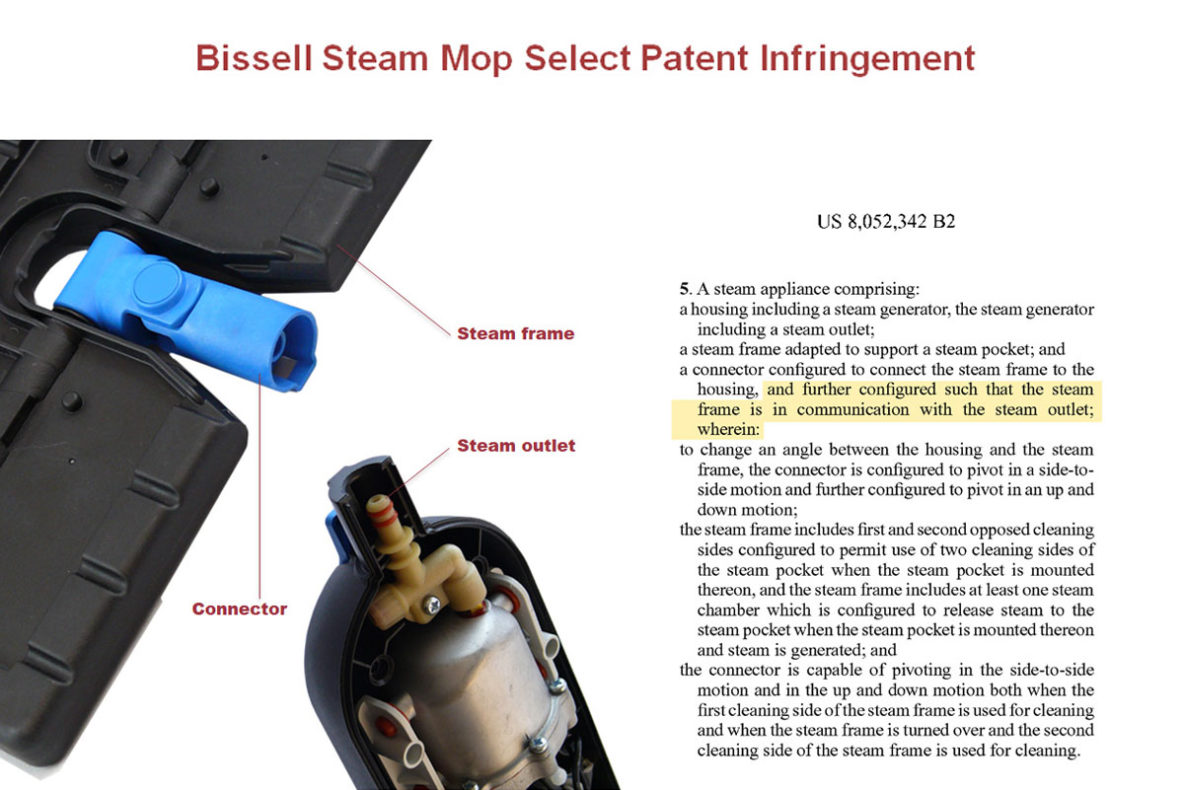
To help prove patent infringement, we combined the client’s patent along-side an exploded view of the infringing product. We placed verbiage from the client’s patent to identify components of the product.
GRAPHIC #34
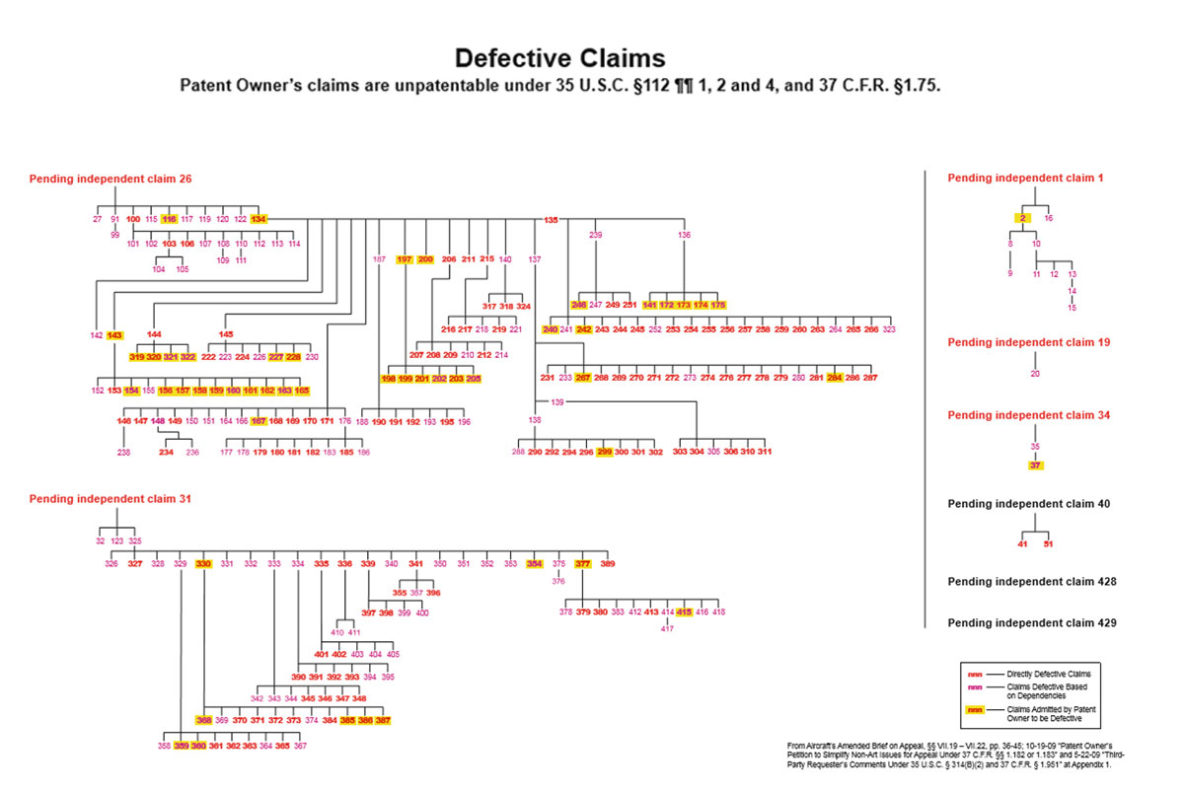
We needed a chart that clearly allowed us to show the interdependent lineage of claims within the patents. These claim relationships would have been difficult to grasp in non-graphic form.
GRAPHIC #29
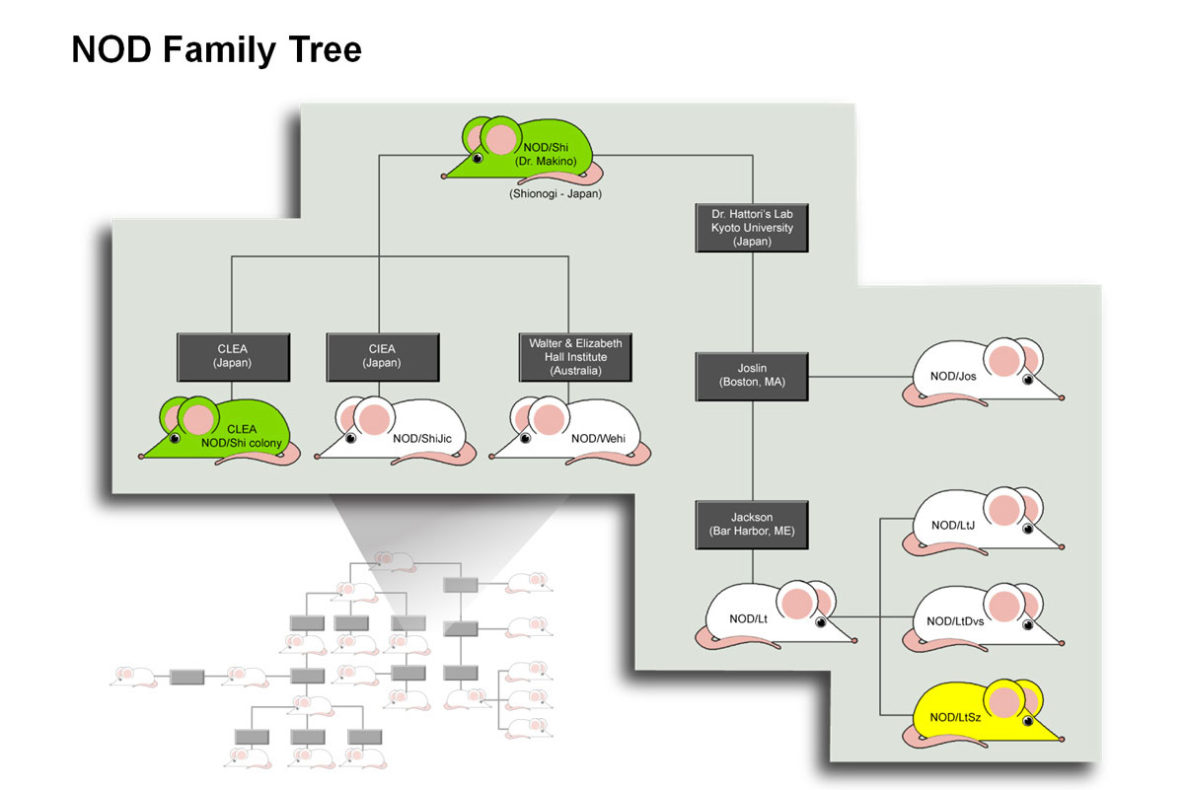
This graphic identifies the genetic traces of the client’s patent present in various strains of laboratory mice.
GRAPHIC #28
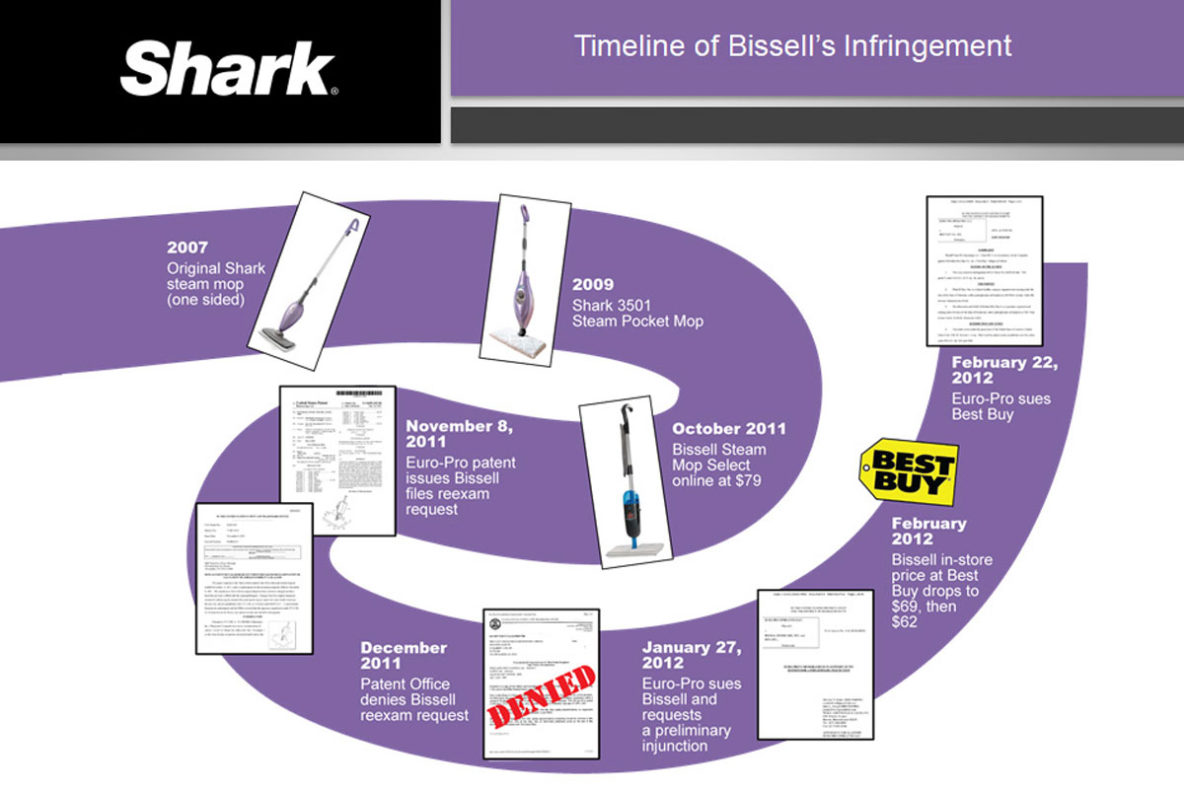
This timeline highlights milestones in the client’s attempt to halt the sale of an infringing product.
GRAPHIC #27
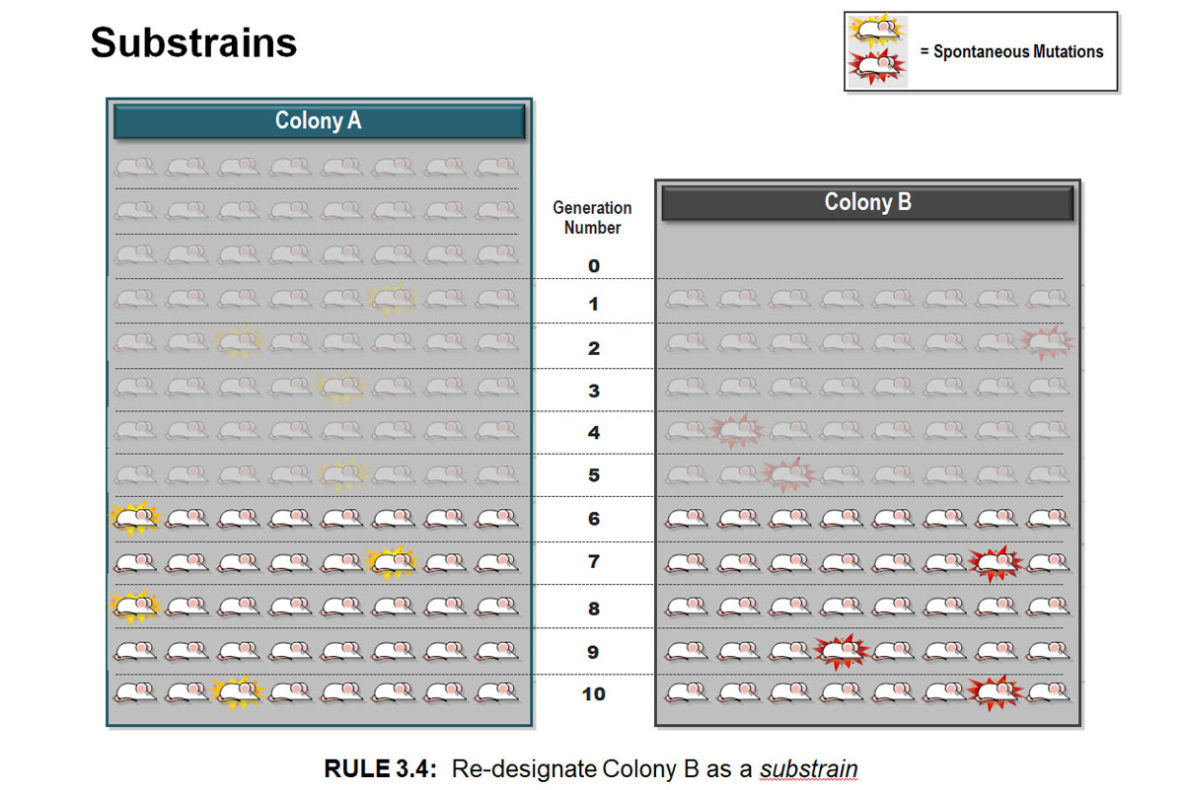
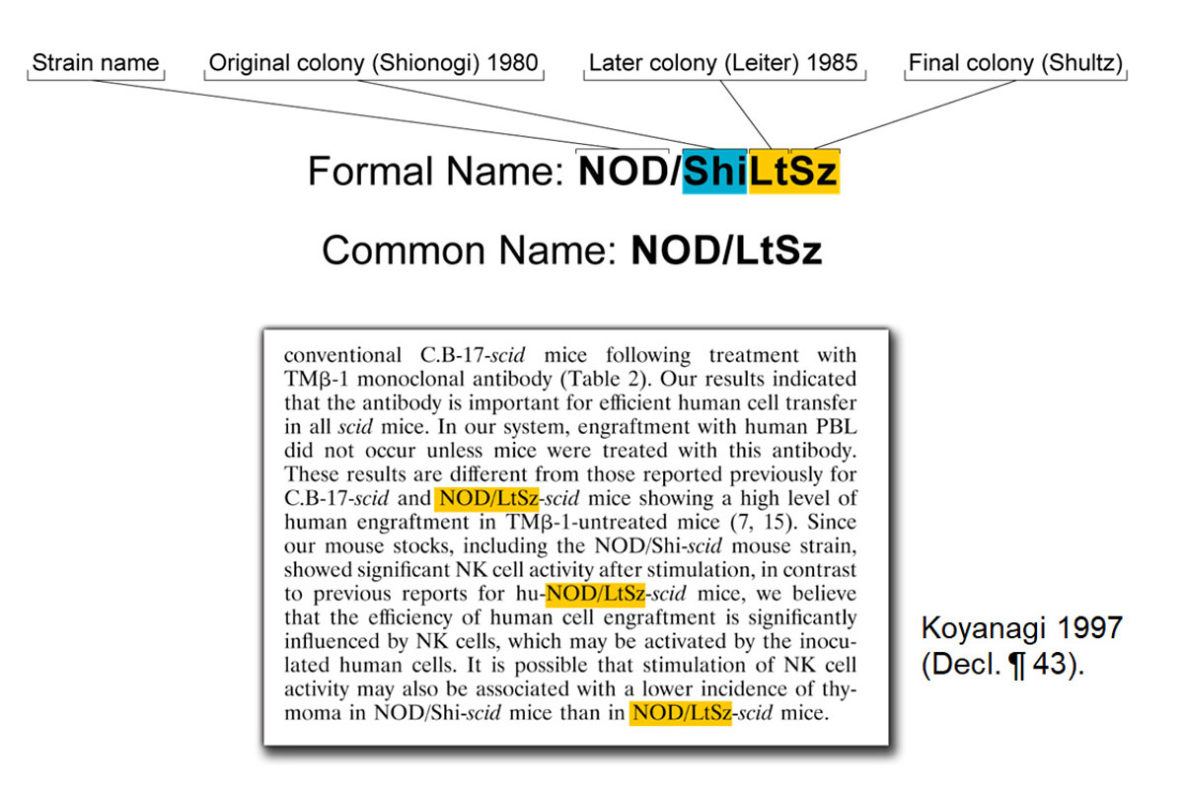
This was part of a Markman hearing describing how mice are genetically classified and re-classified.
GRAPHIC #26
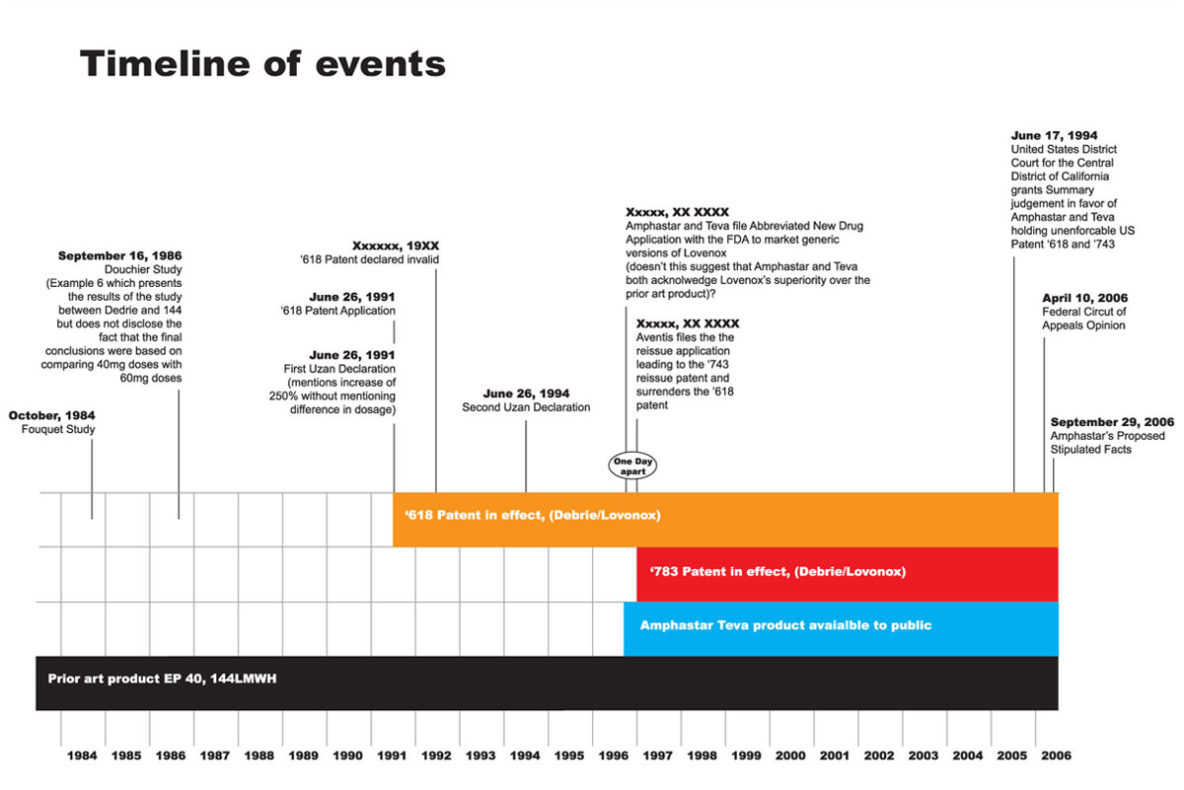
Multiple pharma patents compete with prior art in the development of a generic equivalent. Prior art has been around for awhile.
GRAPHIC #14
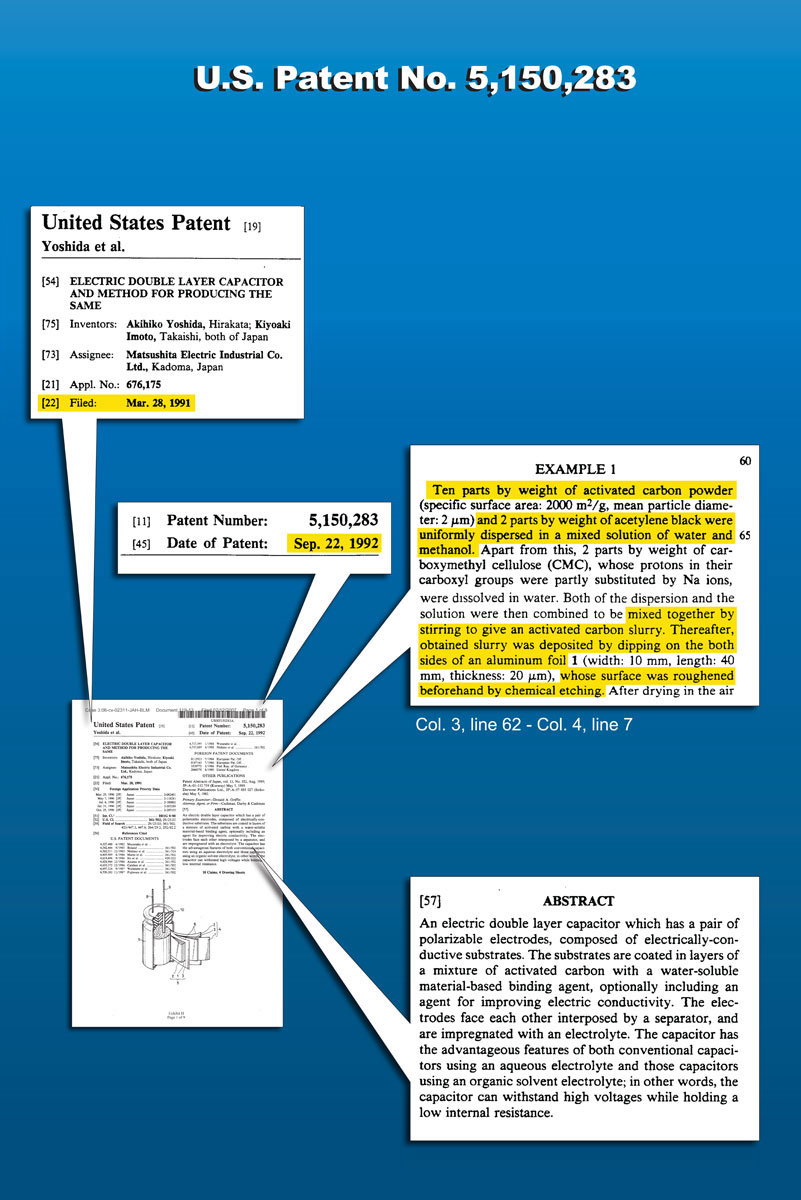
By calling out key elements within the patent we can contain the discussion around pertinent details of the case.
- Page 1 of 2
- 1
- 2