
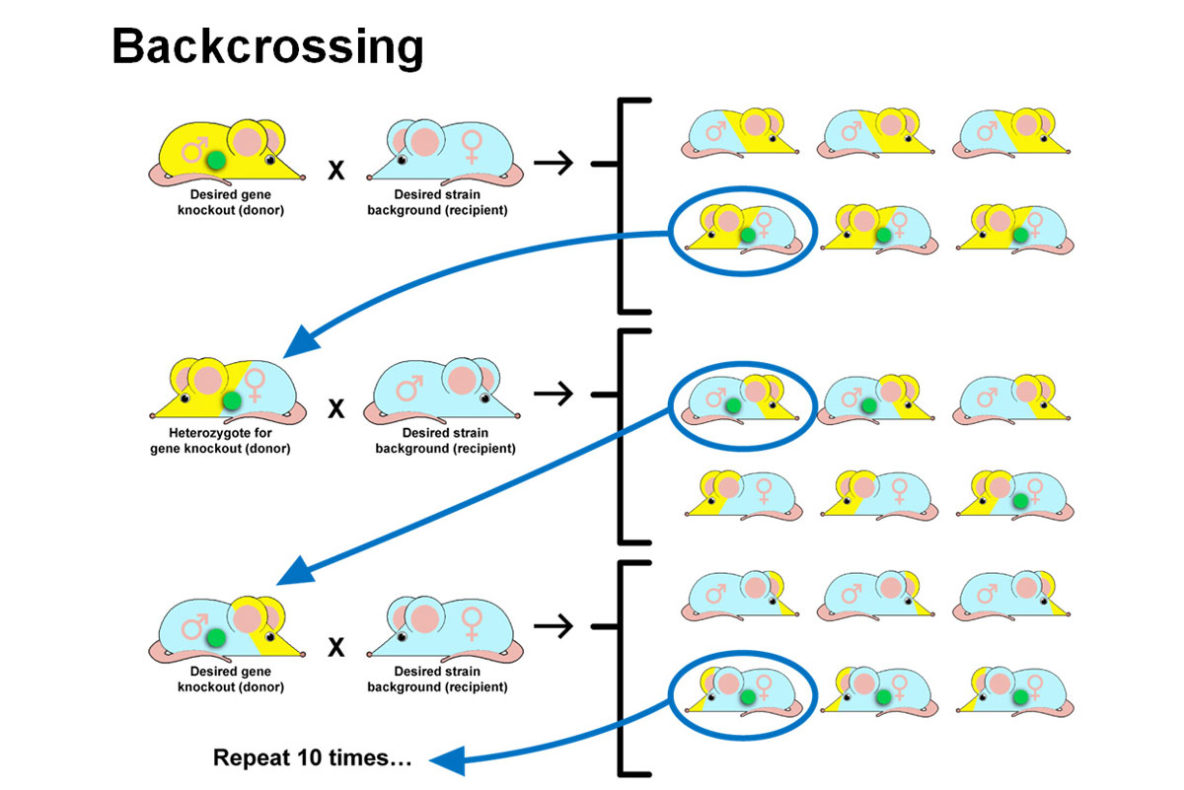
This illustration was part of a Markman hearing describing how mice are genetically bred and classified.
GRAPHIC #32
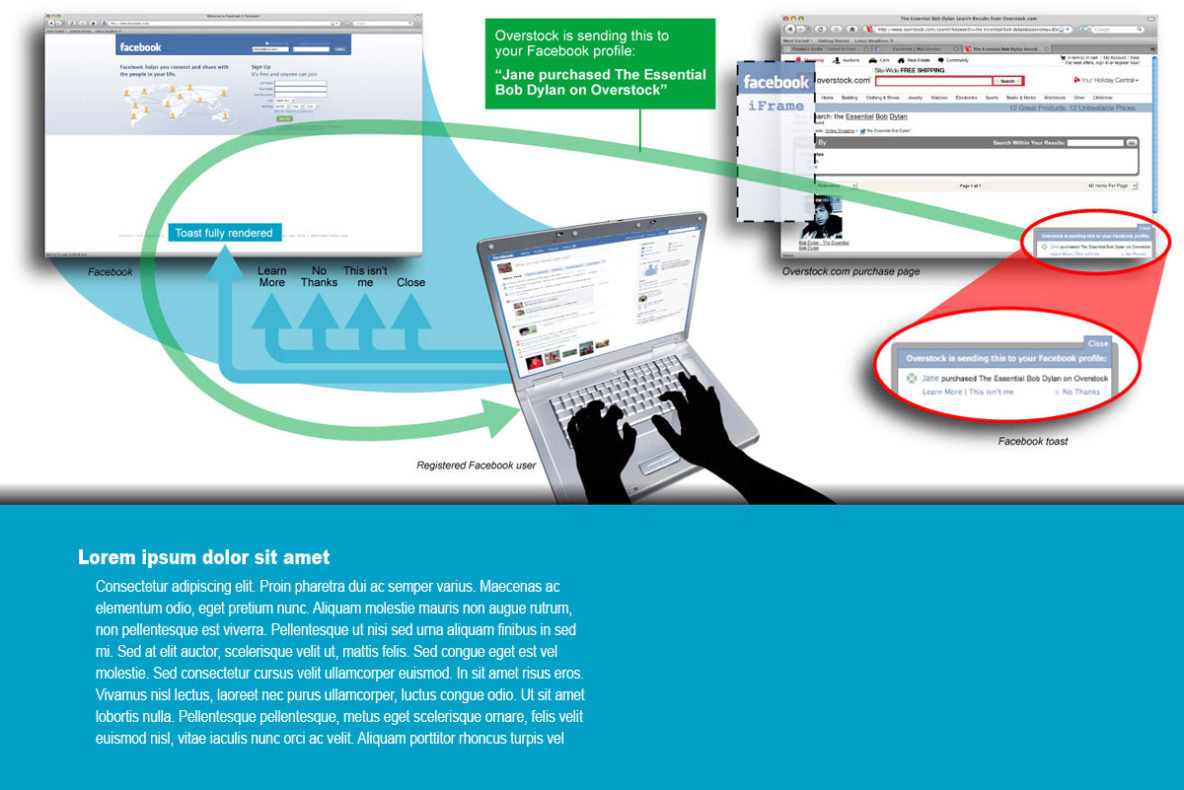
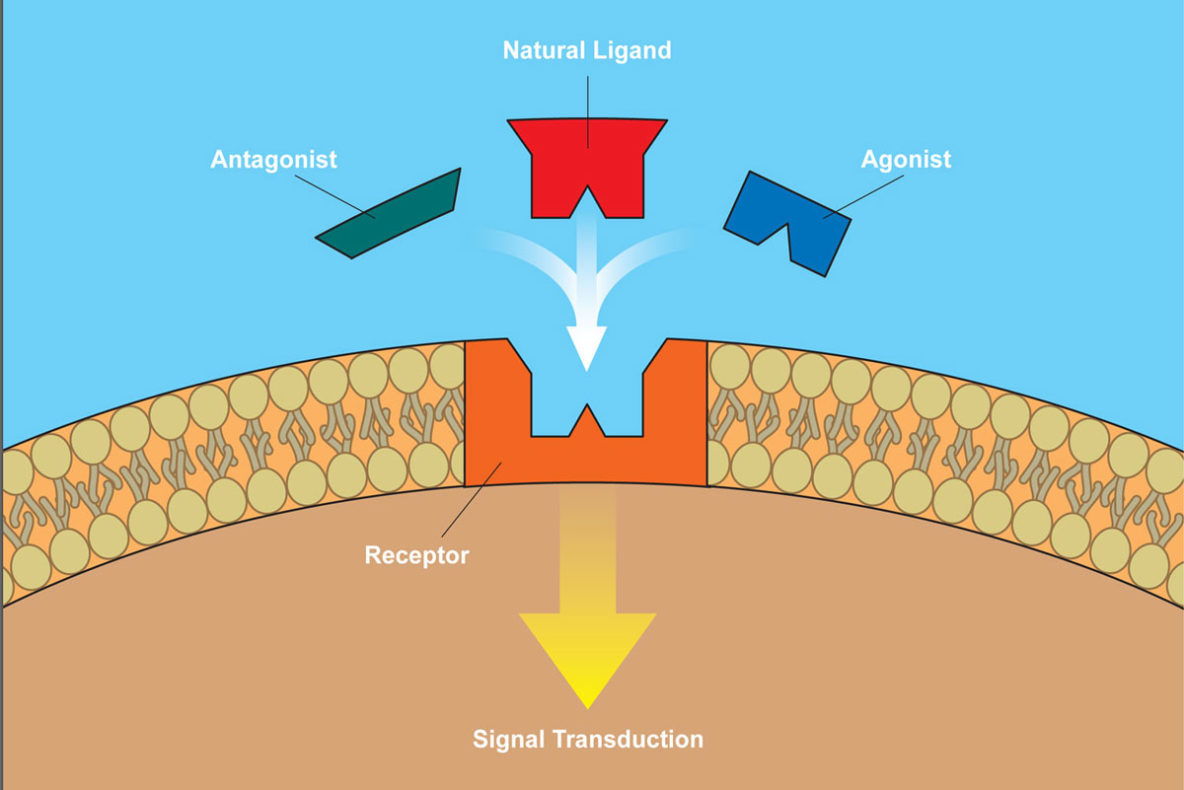
This was part of a Markman hearing describing how Facebook and third-party vendors handle personal data.
GRAPHIC #29
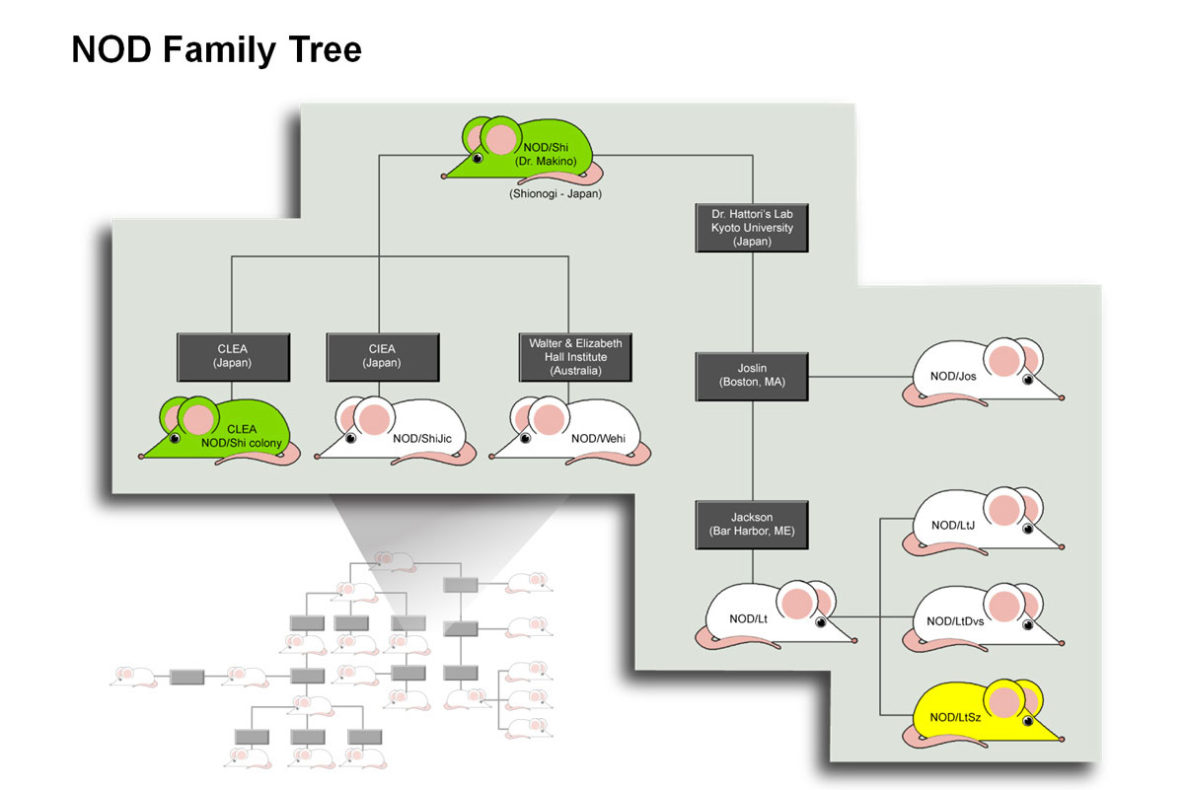
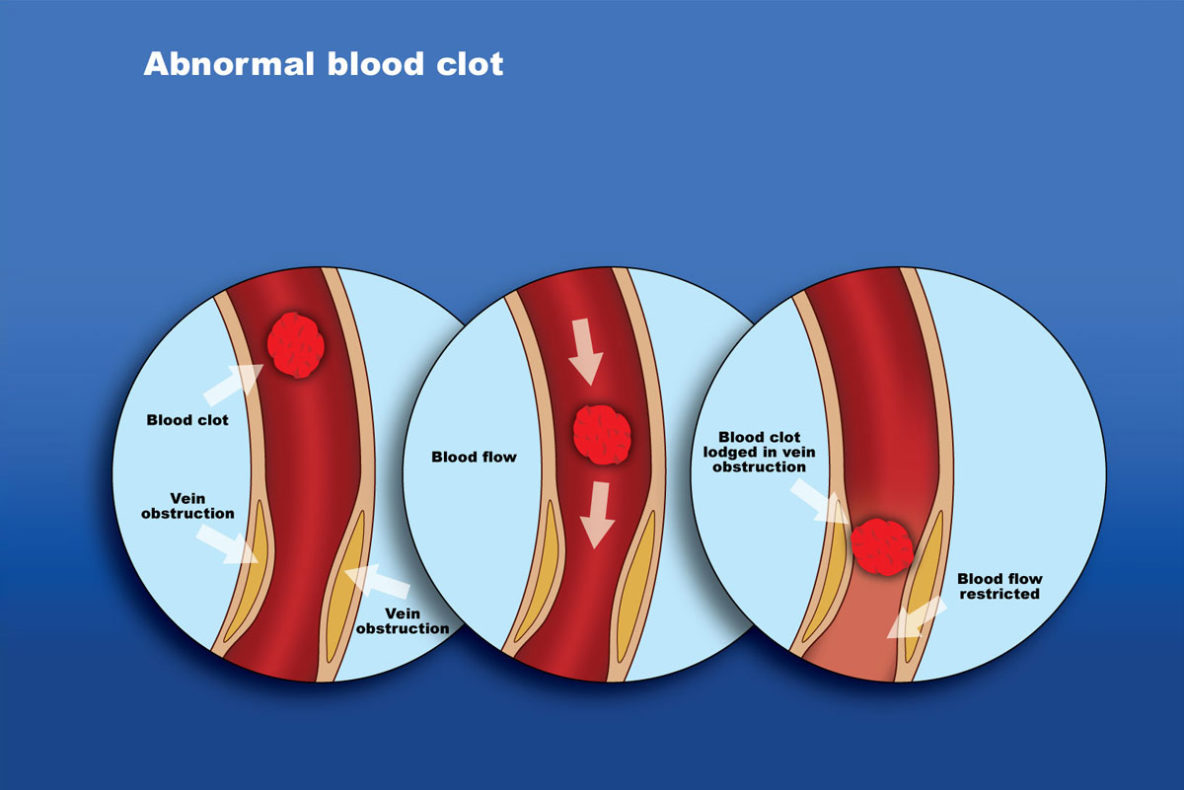
This graphic identifies the genetic traces of the client’s patent present in various strains of laboratory mice.
GRAPHIC #28
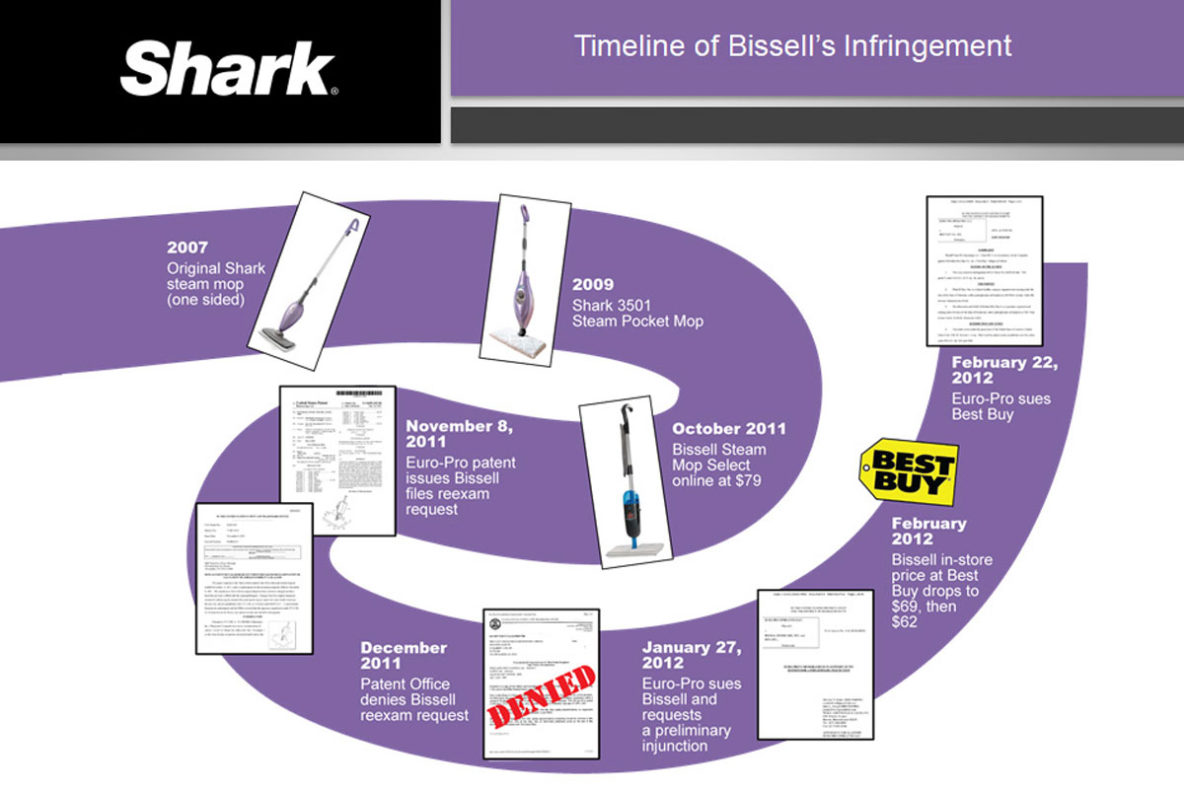
This timeline highlights milestones in the client’s attempt to halt the sale of an infringing product.
GRAPHIC #27
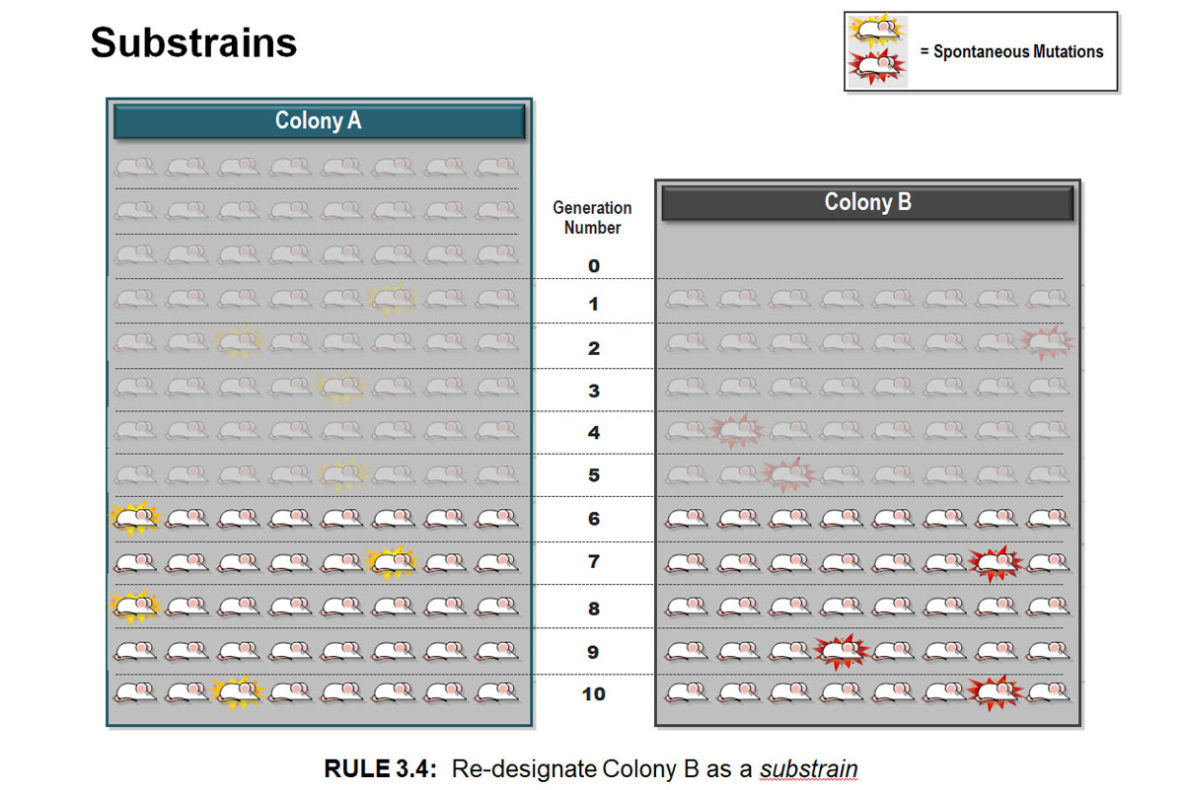
This was part of a Markman hearing describing how mice are genetically classified and re-classified.
GRAPHIC #18
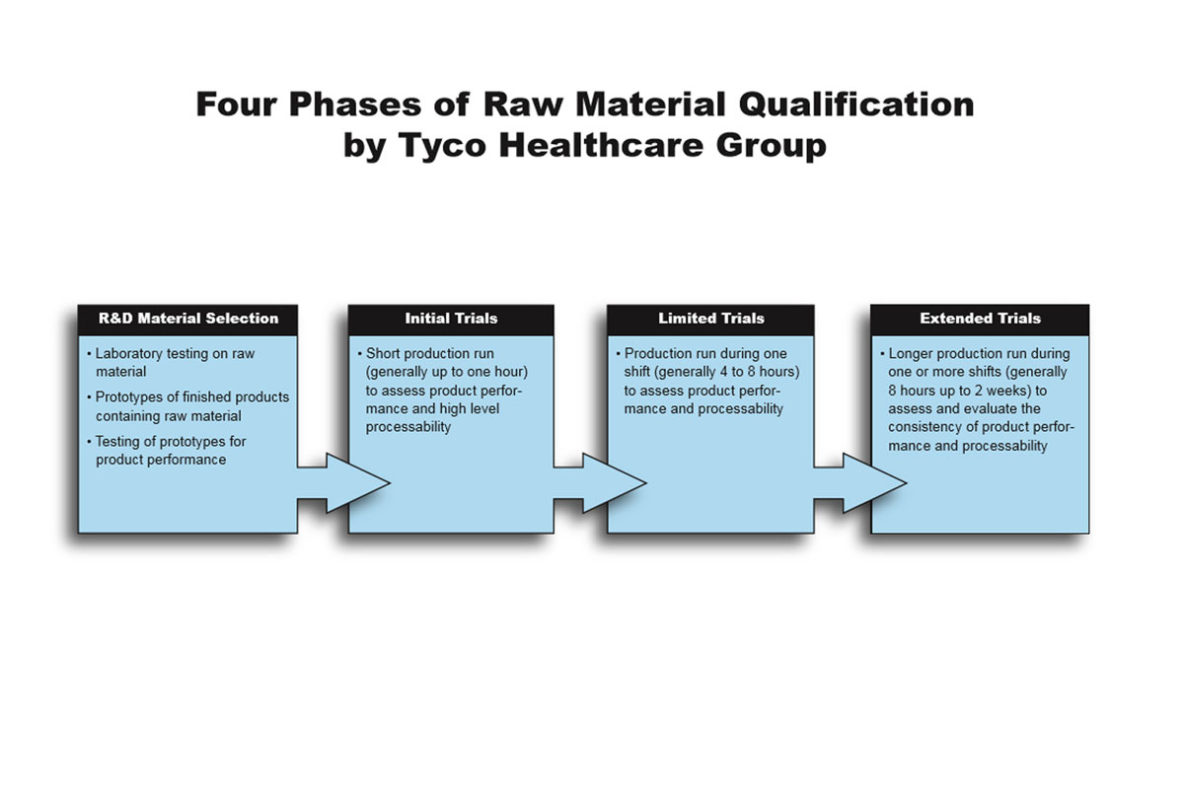
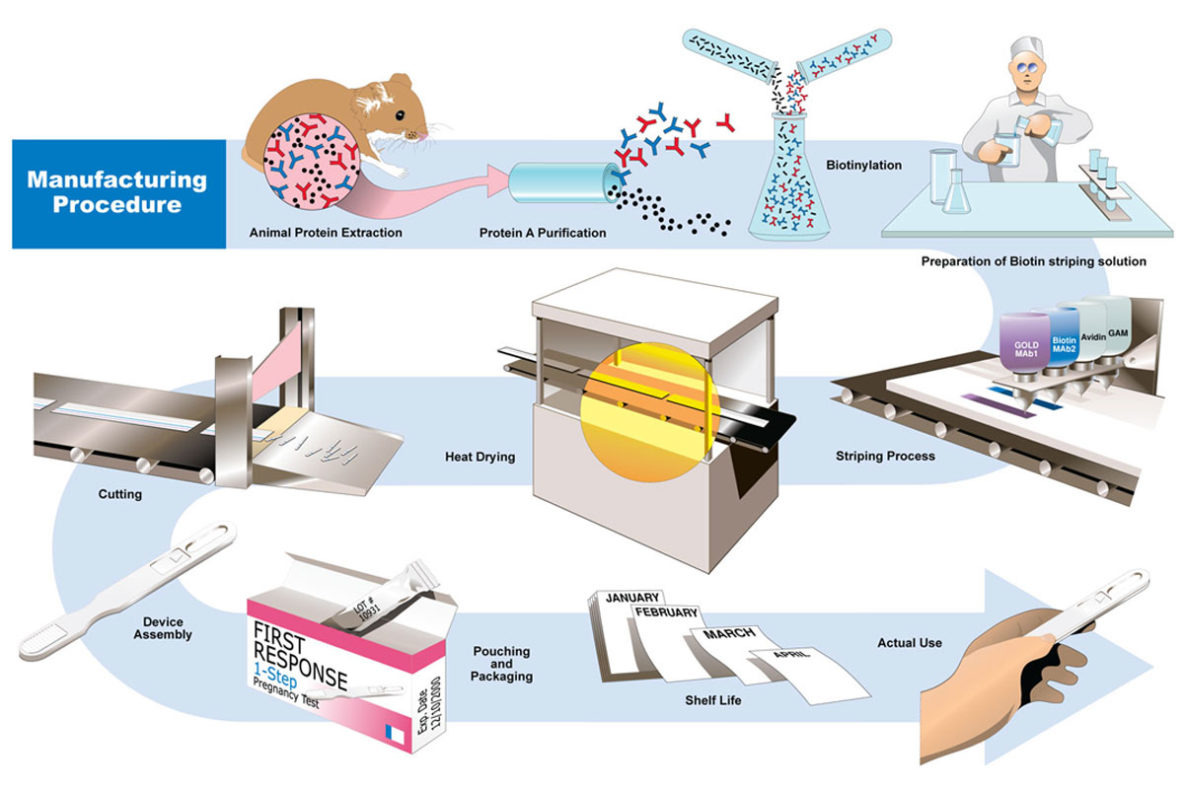
This simple graphic identifies the 4 key steps used by the client in the manufacture of raw materials as well as brief qualifiers within those steps.

- Page 1 of 2
- 1
- 2