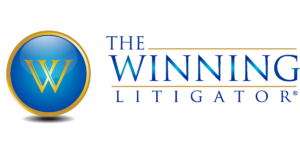
Despite what were clear warning signs that the client’s condition was deteriorating, hospital doctors and nurses continued to administer a harmful course of treatment.
GRAPHIC #40
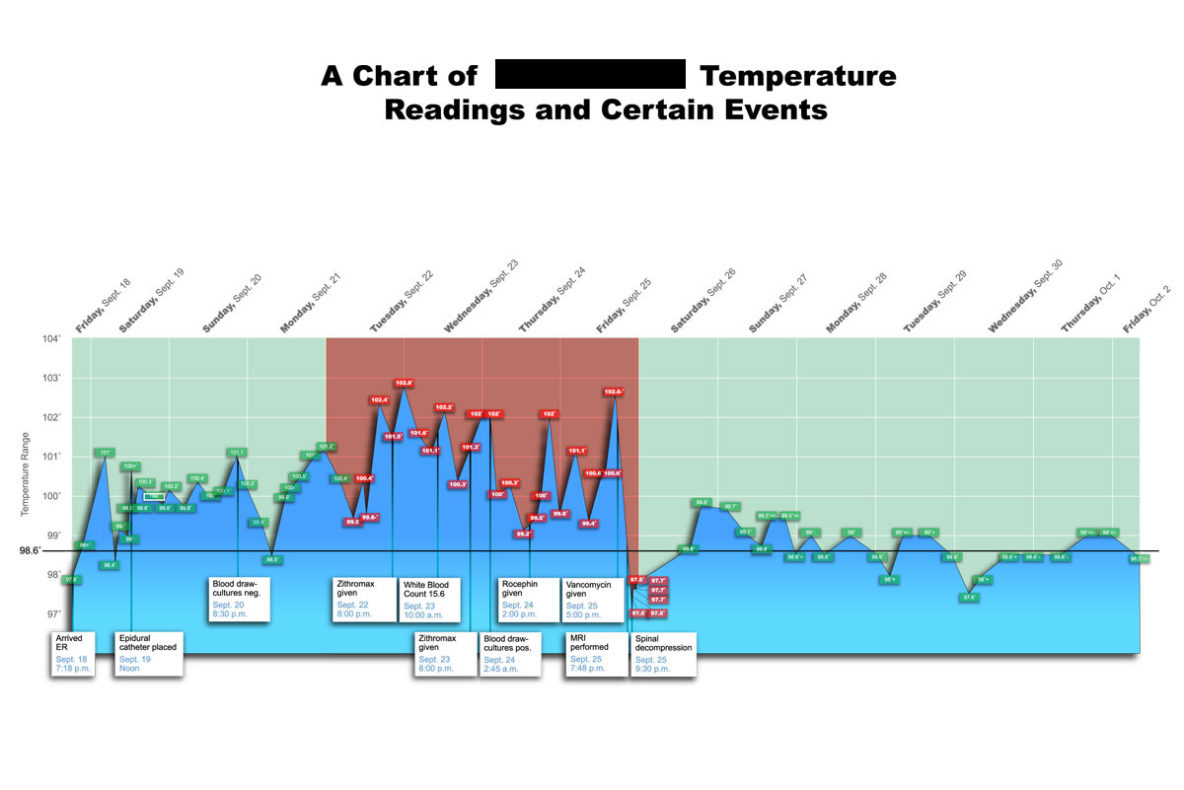
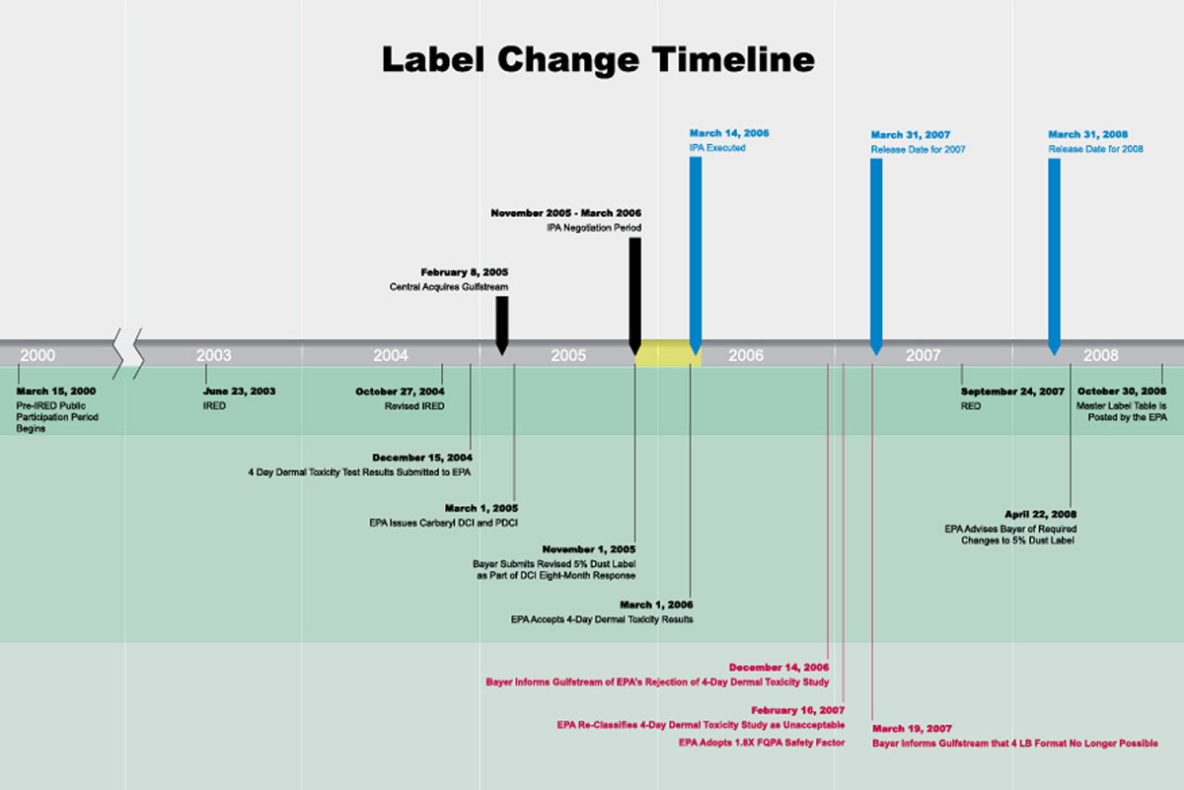
Throughout the entire development process, the client maintained a high-level of involvement and problems arose after that responsibility was shifted to a third party.
GRAPHIC #37
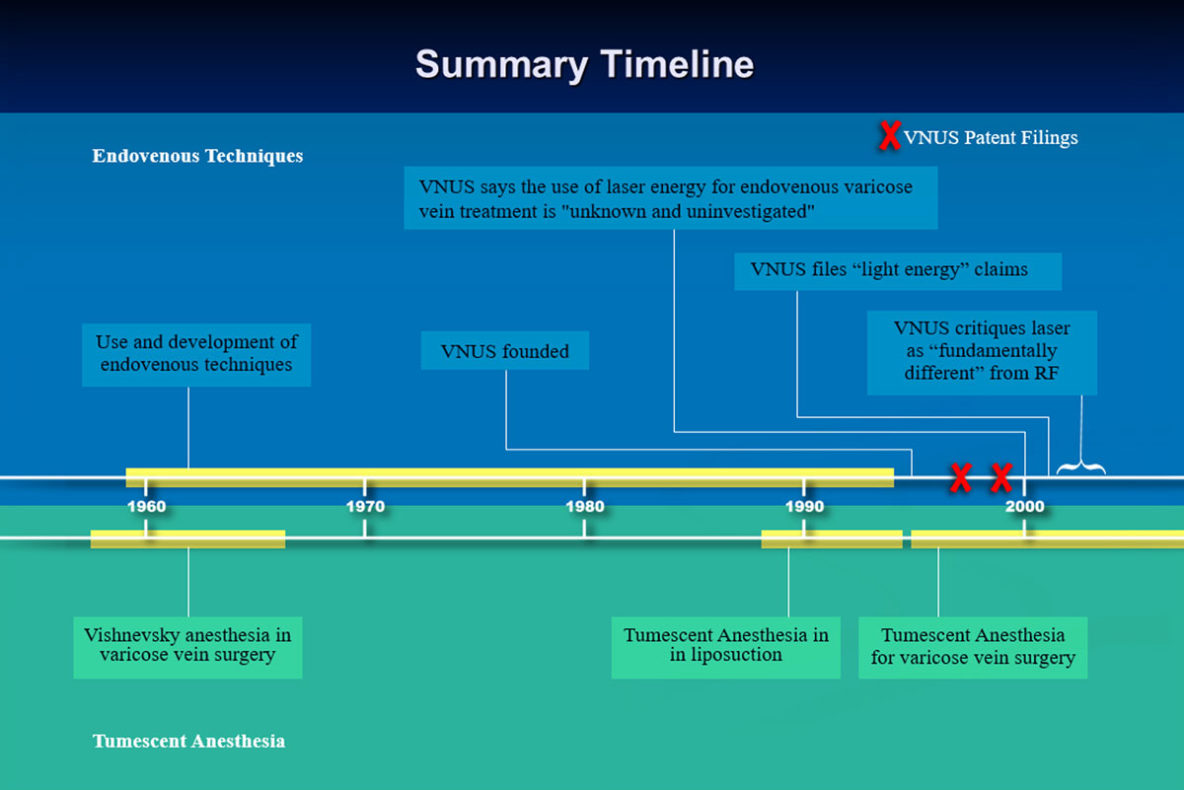
The point made by this illustration is that these technologies have co-existed for decades and have never been mutually exclusive to a type of treatment. The yellow bars reference the time-frames of that co-existence.
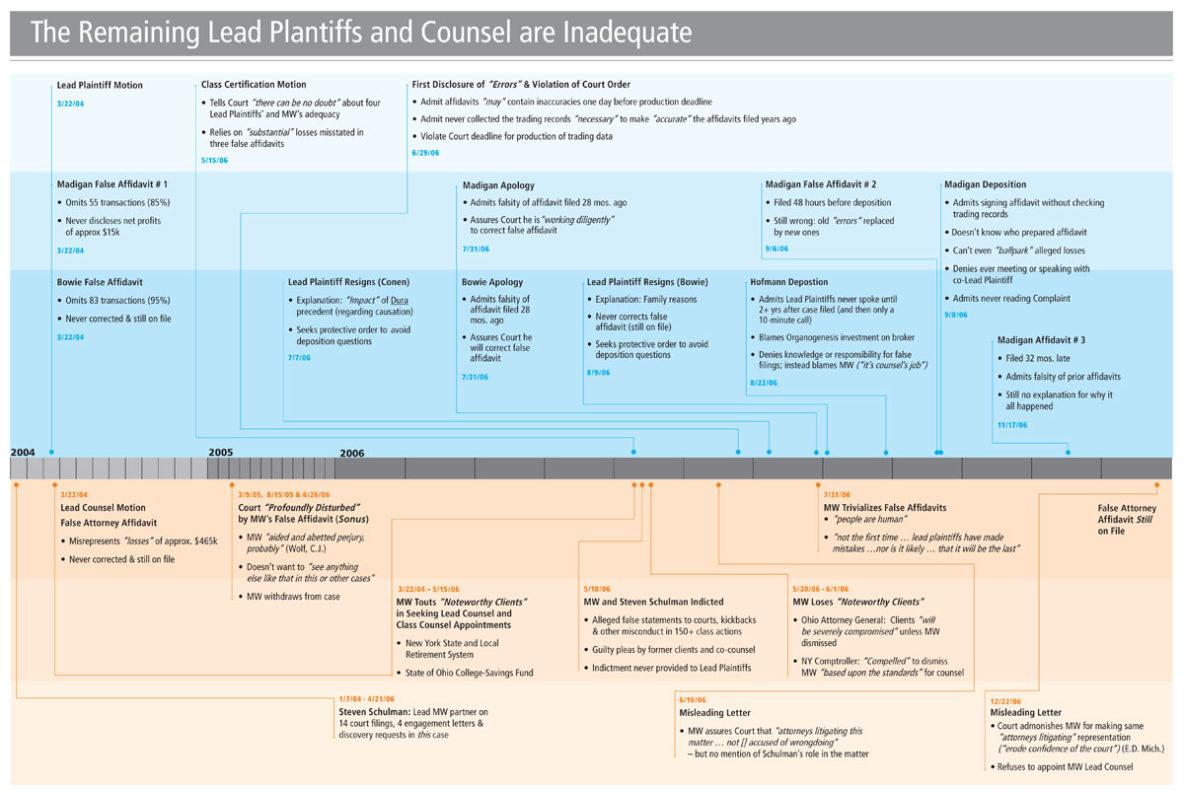
GRAPHIC #28
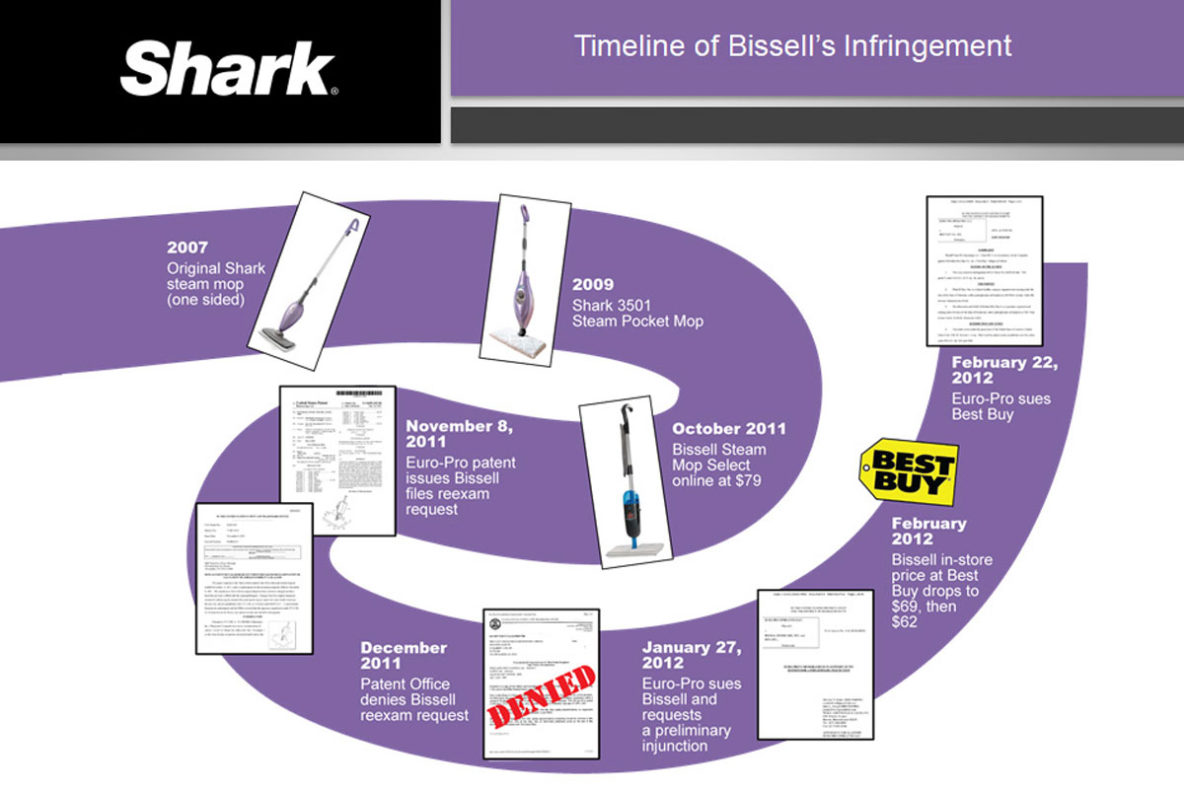
This timeline highlights milestones in the client’s attempt to halt the sale of an infringing product.
GRAPHIC #26
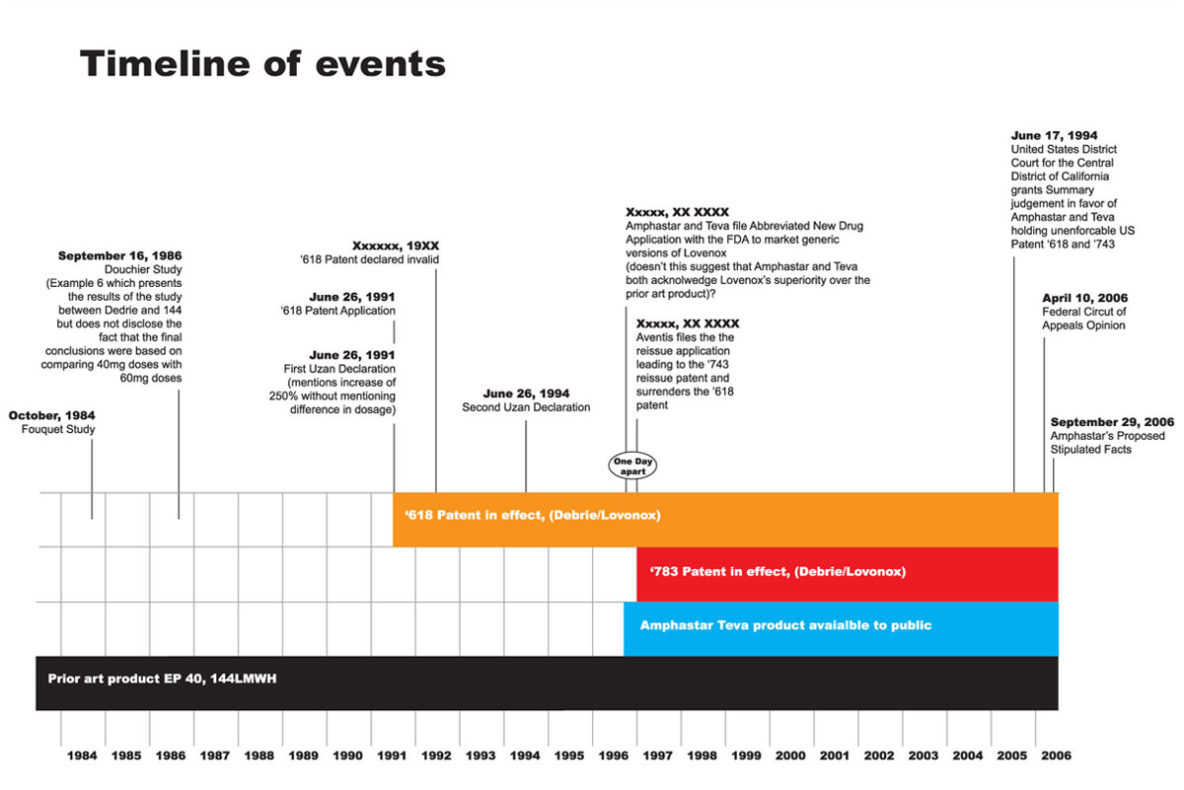
Multiple pharma patents compete with prior art in the development of a generic equivalent. Prior art has been around for awhile.
GRAPHIC #7
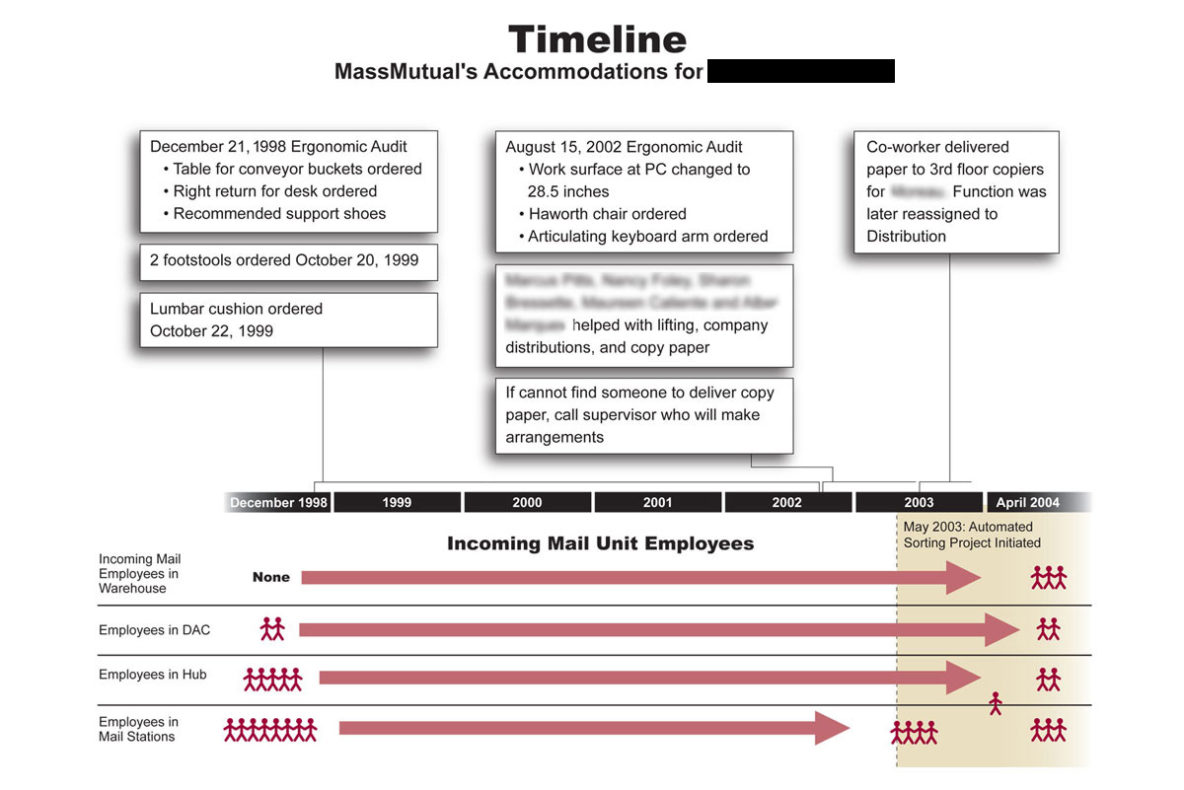
This graphic illustrates the efforts made by the employer accommodate an employee with a claimed disability.