
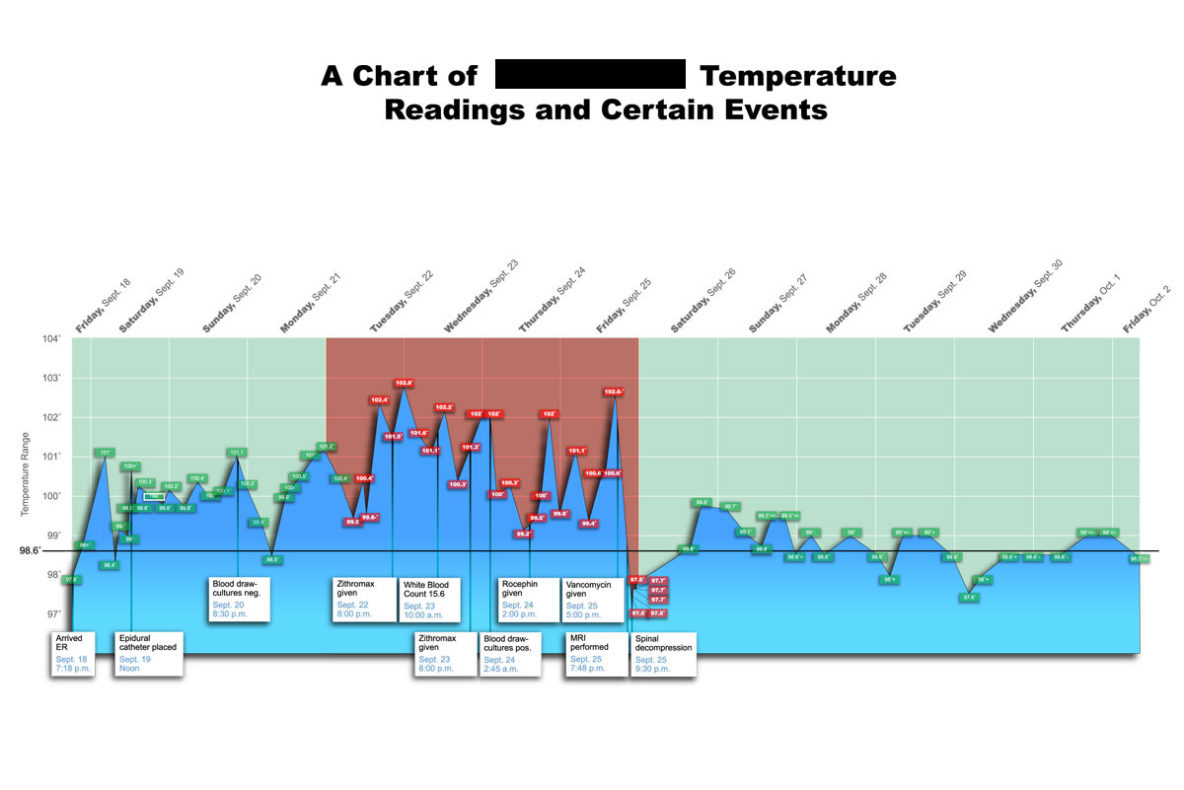
Despite what were clear warning signs that the client’s condition was deteriorating, hospital doctors and nurses continued to administer a harmful course of treatment.
GRAPHIC #33
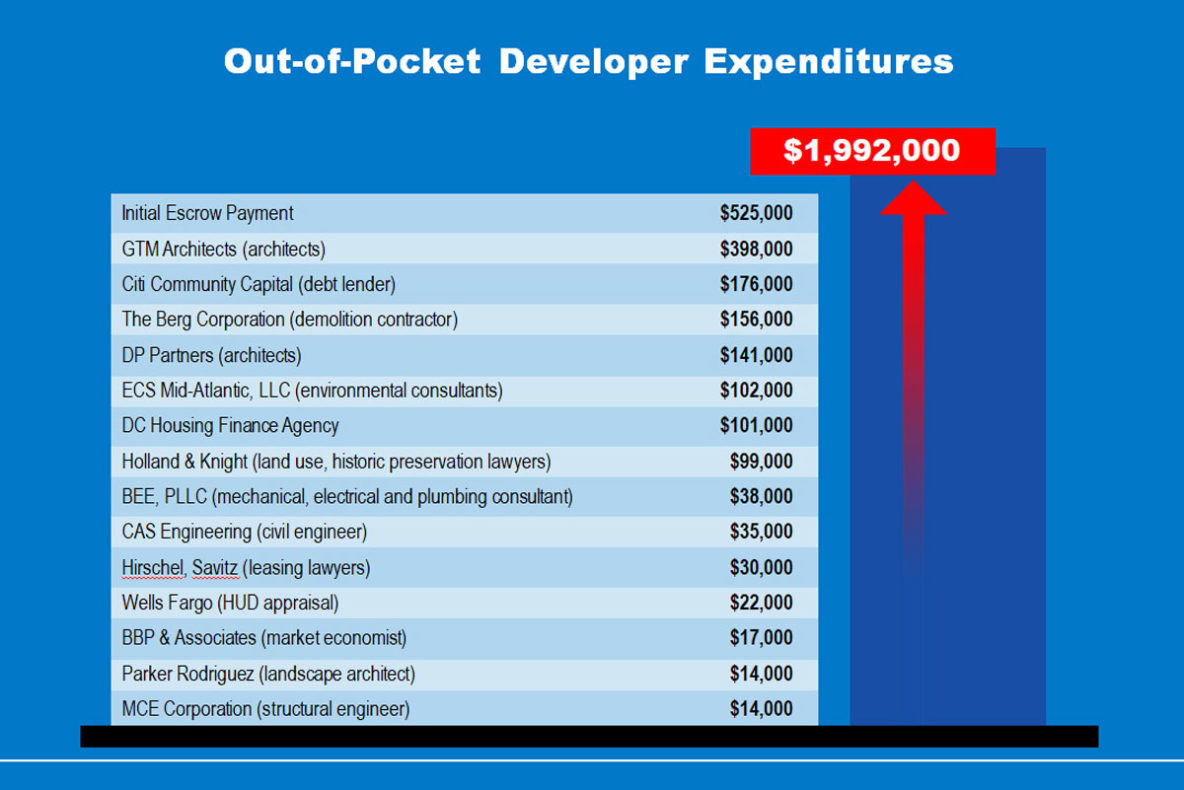
Our client’s expenses in satisfying the demands of a development project far exceeded expectations and continue to increase. This illustration was used, in part, to rebut the suggestion that our client was not acting in good faith to move the project forward.
GRAPHIC #30
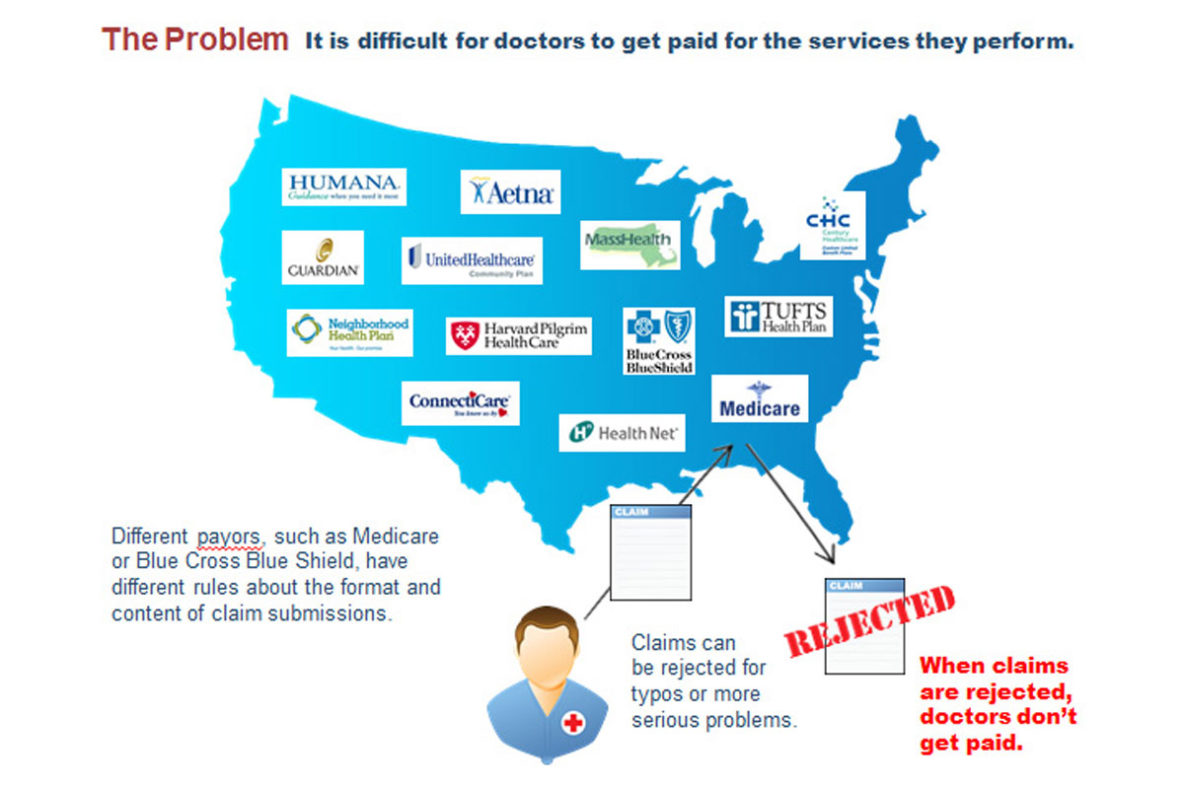
This graphic was to introduce the audience to the problem that the client’s patent solved.
GRAPHIC #27
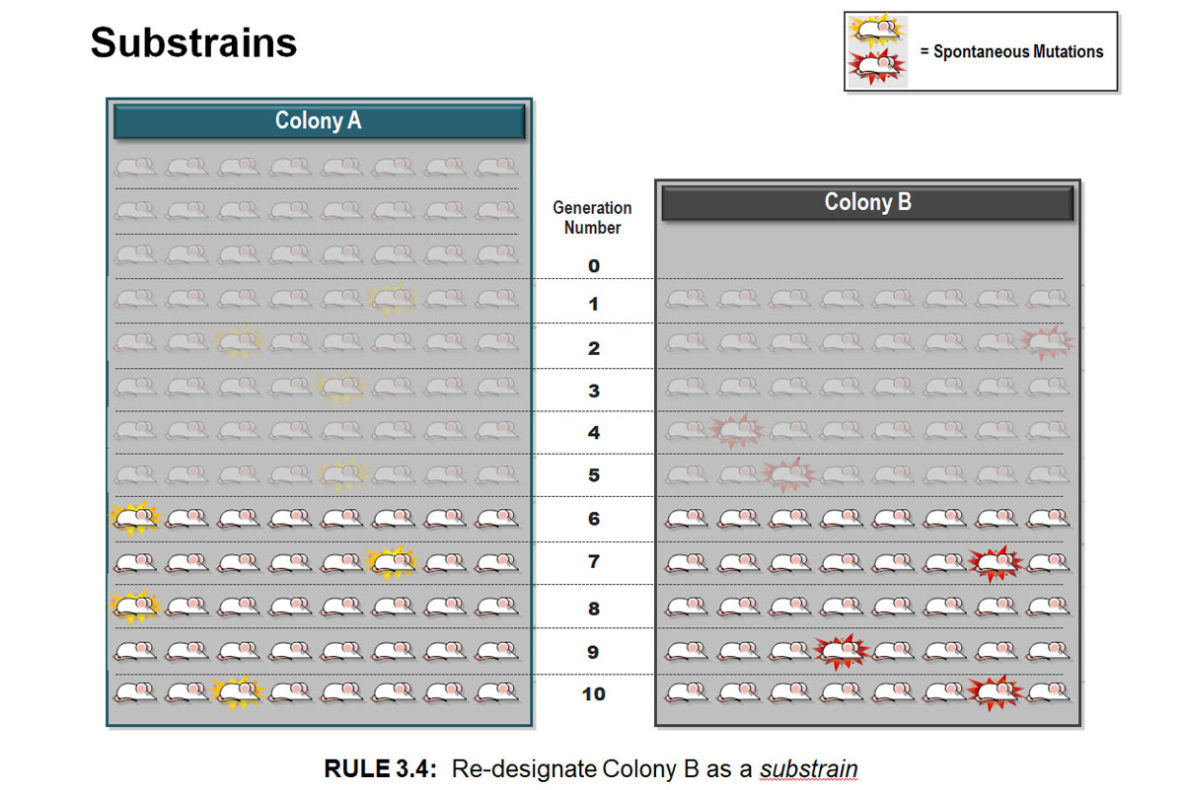
This was part of a Markman hearing describing how mice are genetically classified and re-classified.
GRAPHIC #6
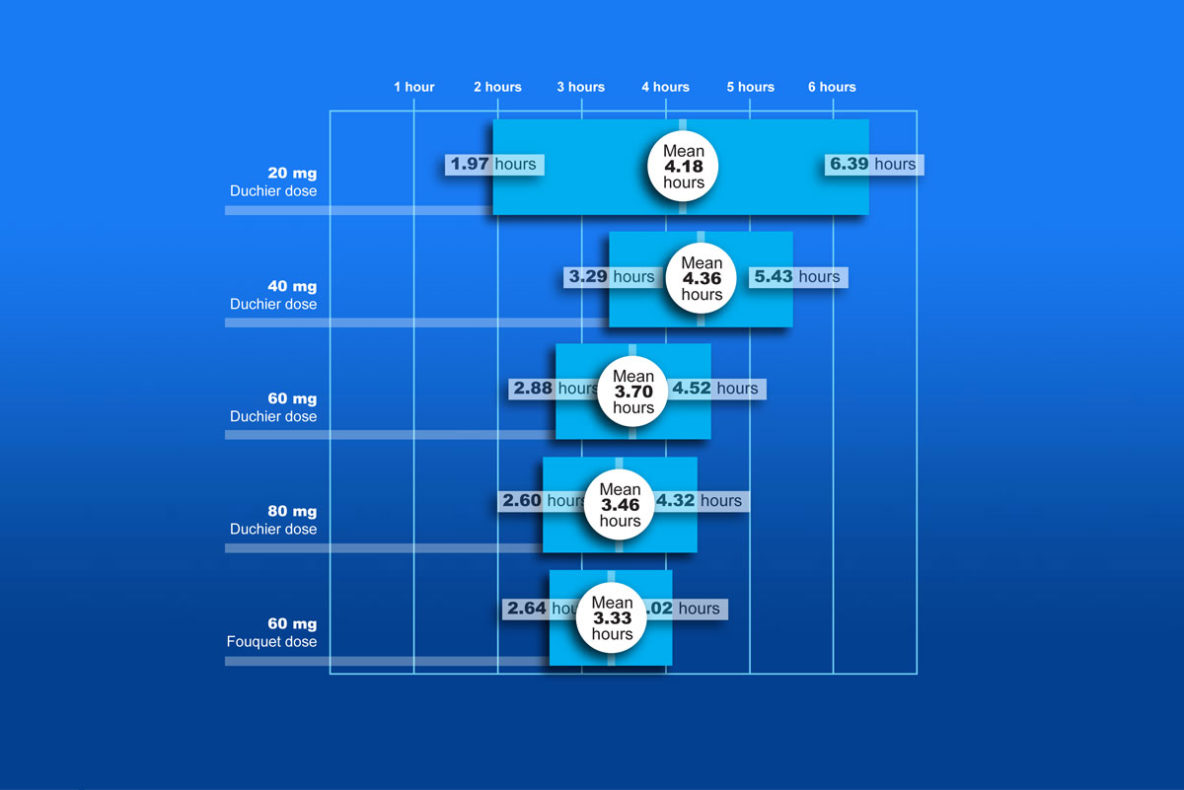
Once the mean similarities are placed along-side the dose and duration information, one can see the different contributing factors affecting the results.
GRAPHIC #5
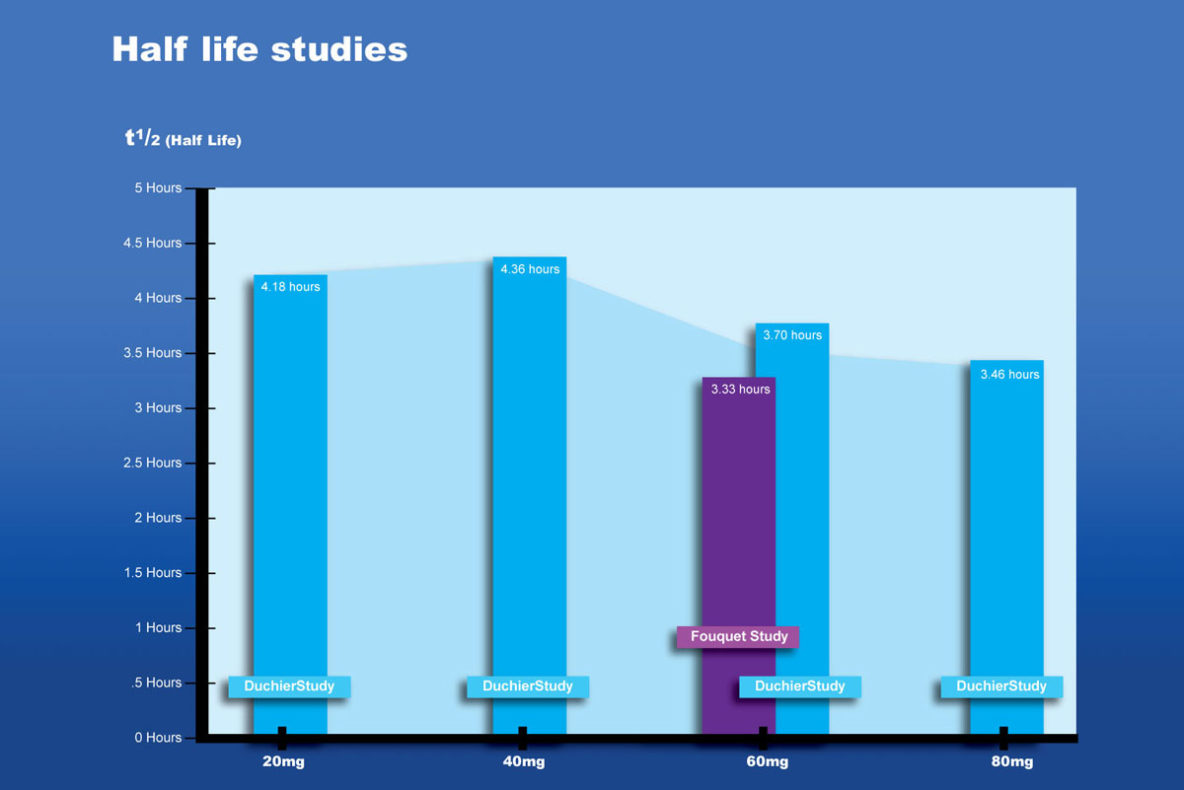
Similarities and exceptions become more obvious when the information is viewed from the correct angle.