
Correspondence pointing directly to the patent infringer’s first contact with the client’s product.
GRAPHIC #42
Plaintiff claimed that the presence of carbon in the client’s aluminum capacitors was proof of patent violation. In order to prove that claim, a slice would have to be taken from the capacitor for examination. A by-product of the slicing process is carbon, making the tests inconclusive.
GRAPHIC #41
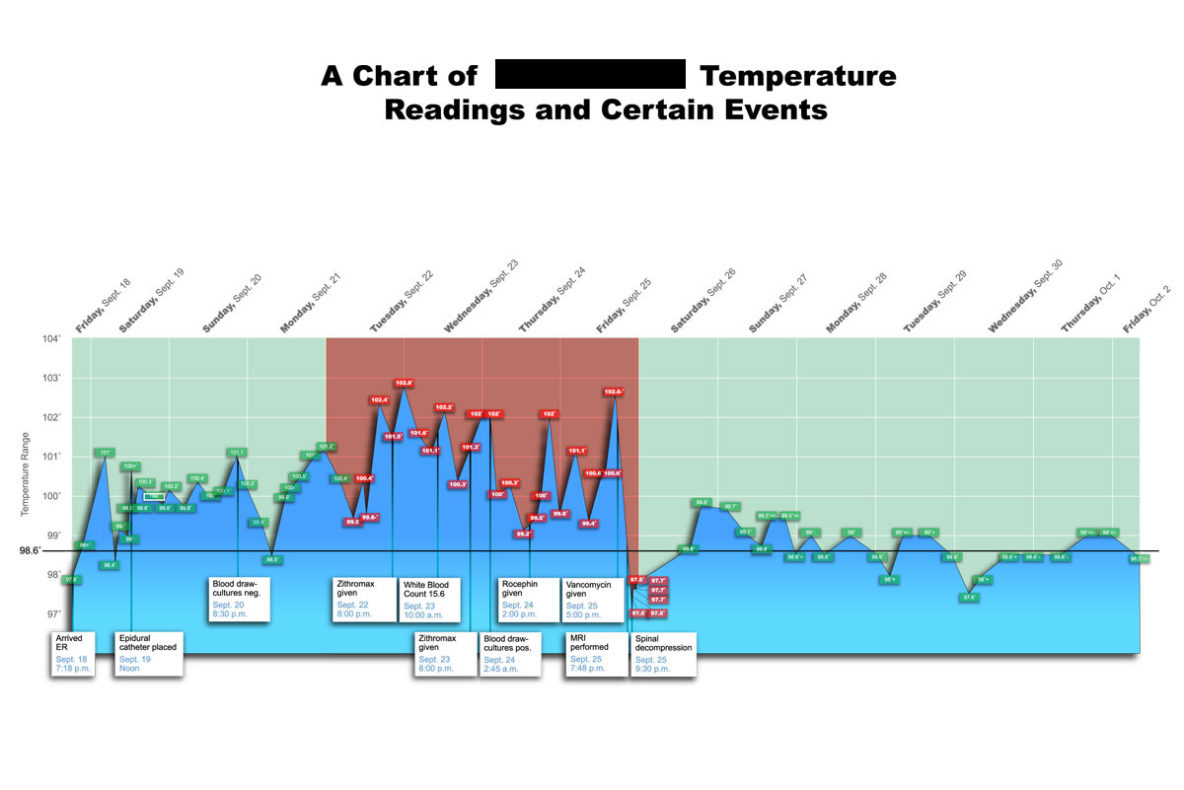
Despite what were clear warning signs that the client’s condition was deteriorating, hospital doctors and nurses continued to administer a harmful course of treatment.
GRAPHIC #40
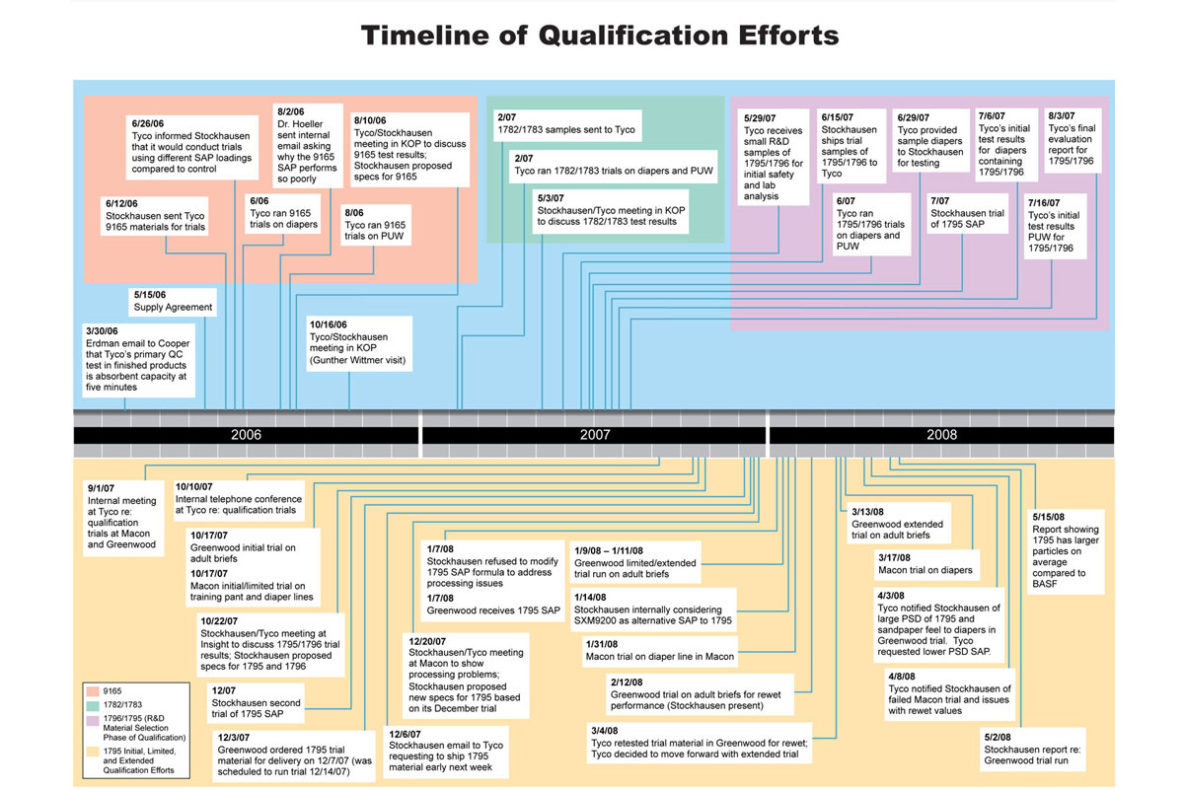
Throughout the entire development process, the client maintained a high-level of involvement and problems arose after that responsibility was shifted to a third party.
GRAPHIC #39
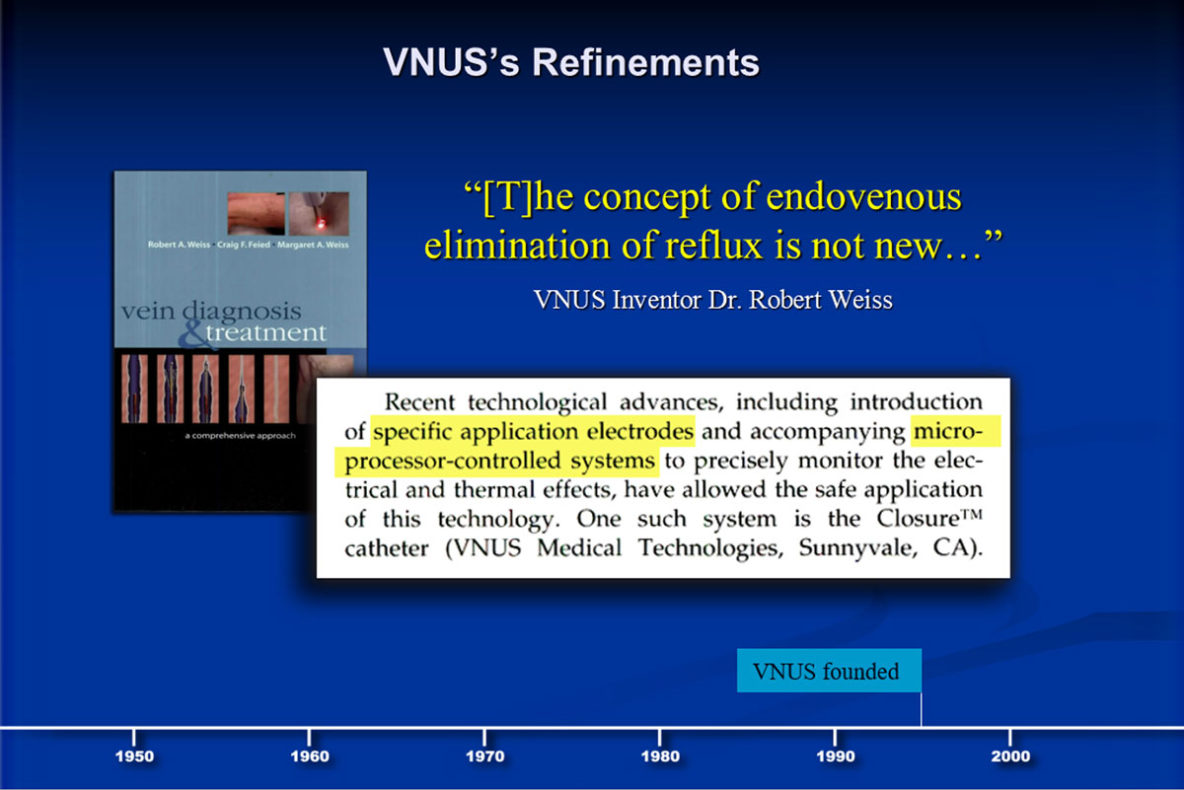
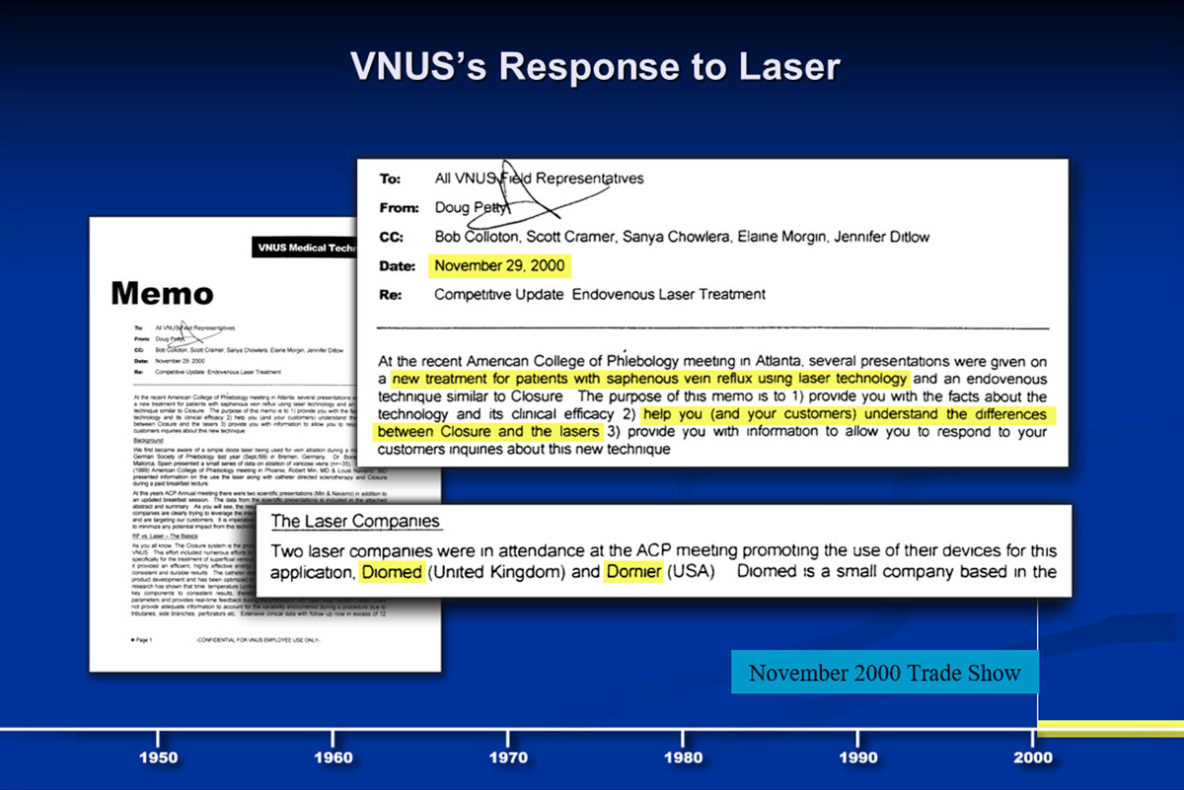
In order to establish credibility without being verbose, we visually referenced the source of the highlighted quote.
GRAPHIC #37
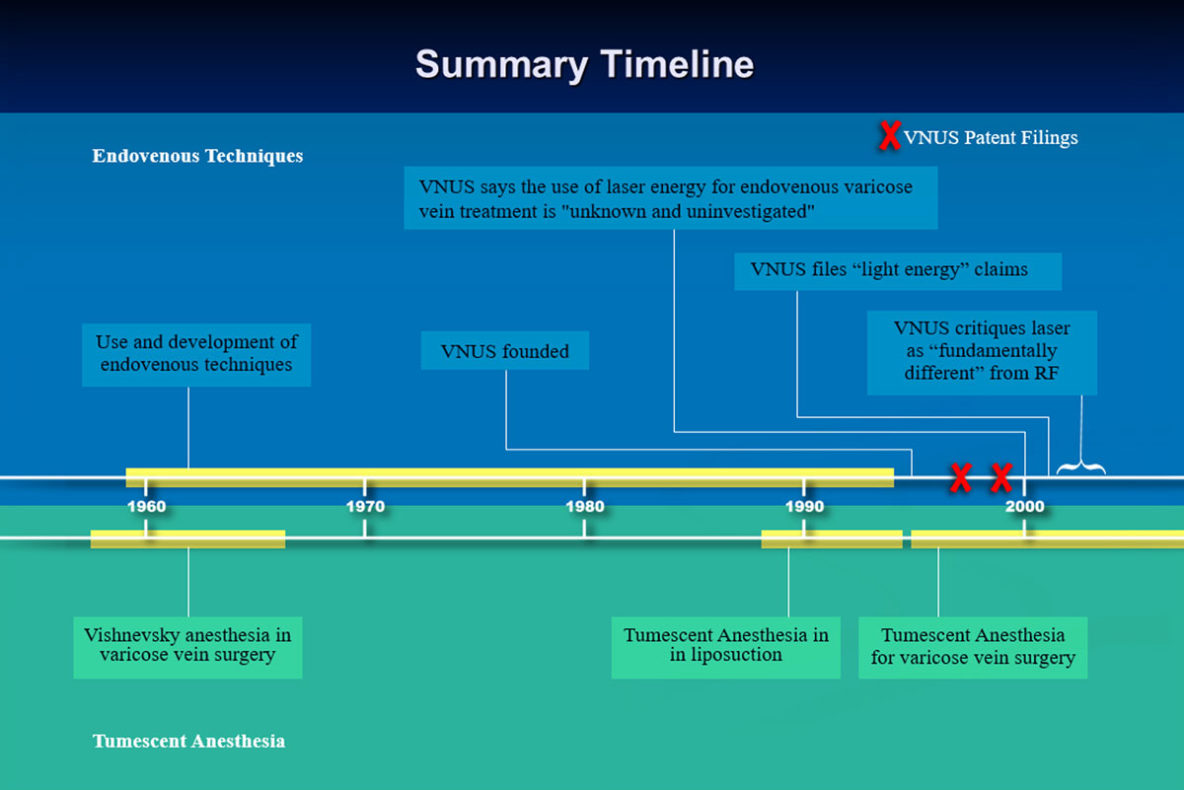
The point made by this illustration is that these technologies have co-existed for decades and have never been mutually exclusive to a type of treatment. The yellow bars reference the time-frames of that co-existence.
GRAPHIC #36
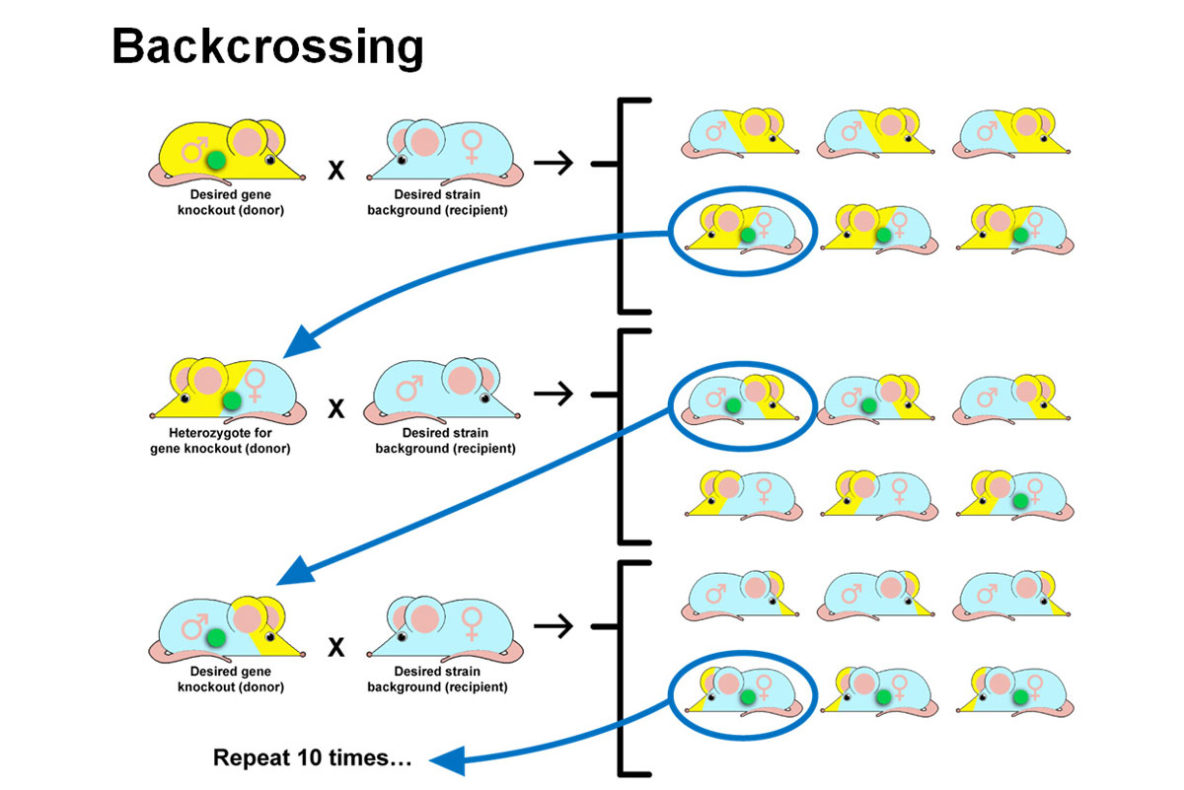
This illustration was part of a Markman hearing describing how mice are genetically bred and classified.
GRAPHIC #35
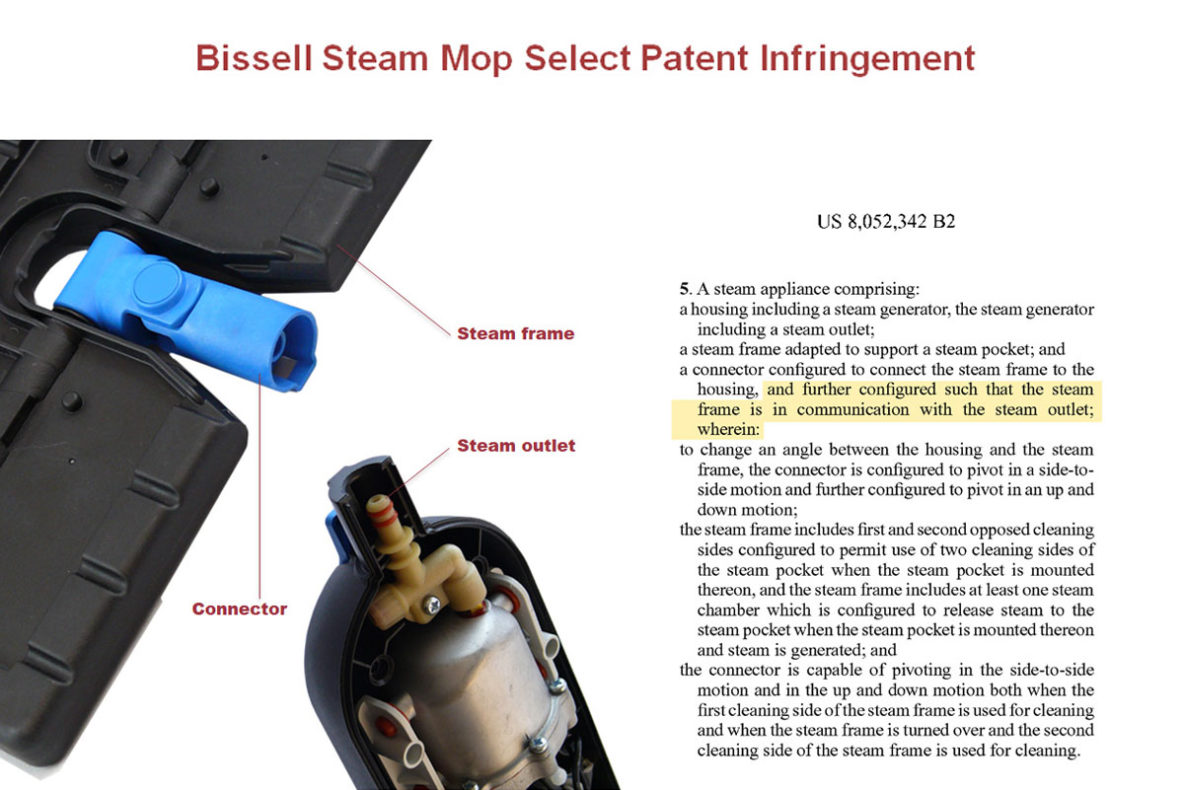
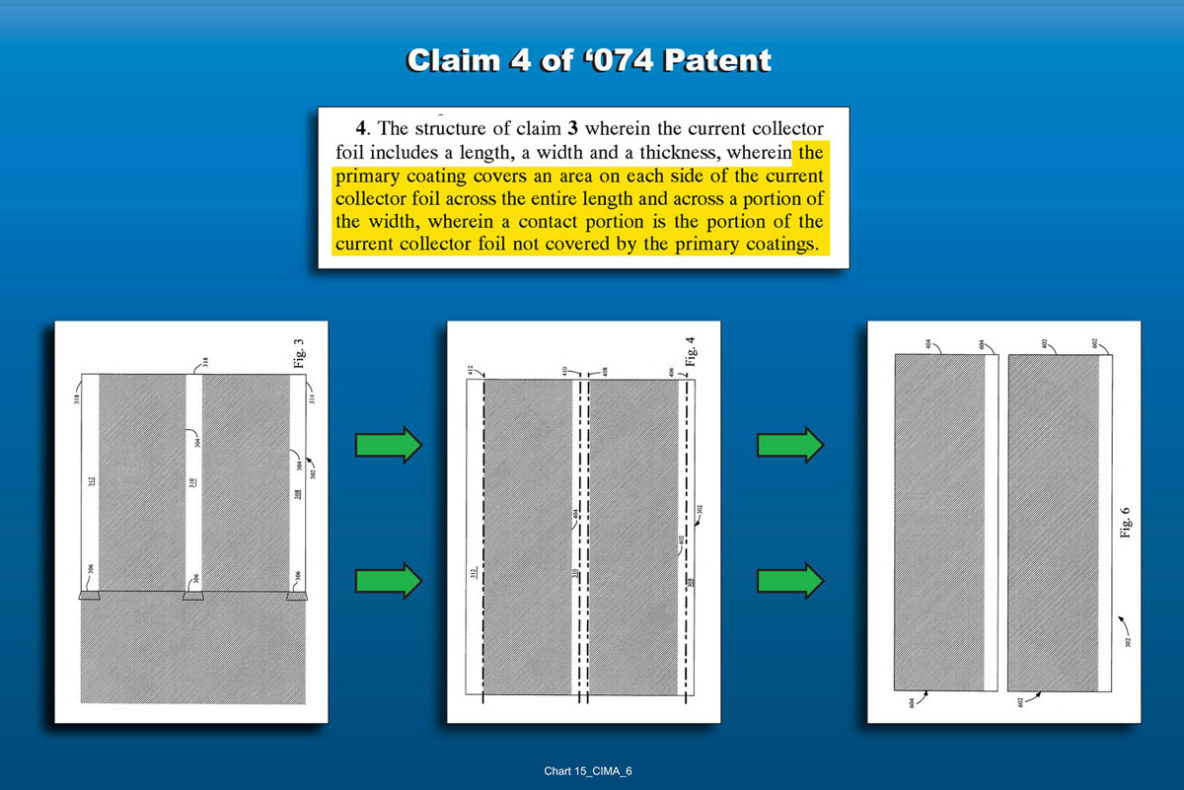
To help prove patent infringement, we combined the client’s patent along-side an exploded view of the infringing product. We placed verbiage from the client’s patent to identify components of the product.
GRAPHIC #34
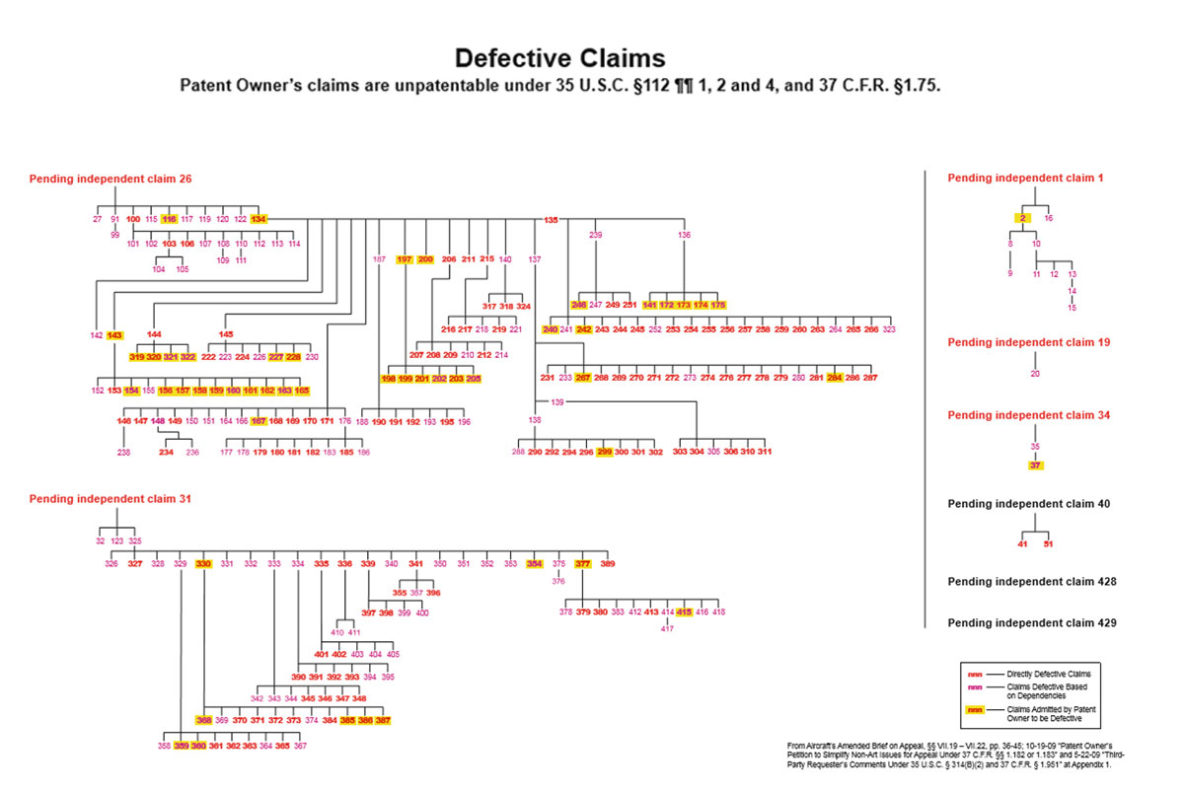
We needed a chart that clearly allowed us to show the interdependent lineage of claims within the patents. These claim relationships would have been difficult to grasp in non-graphic form.