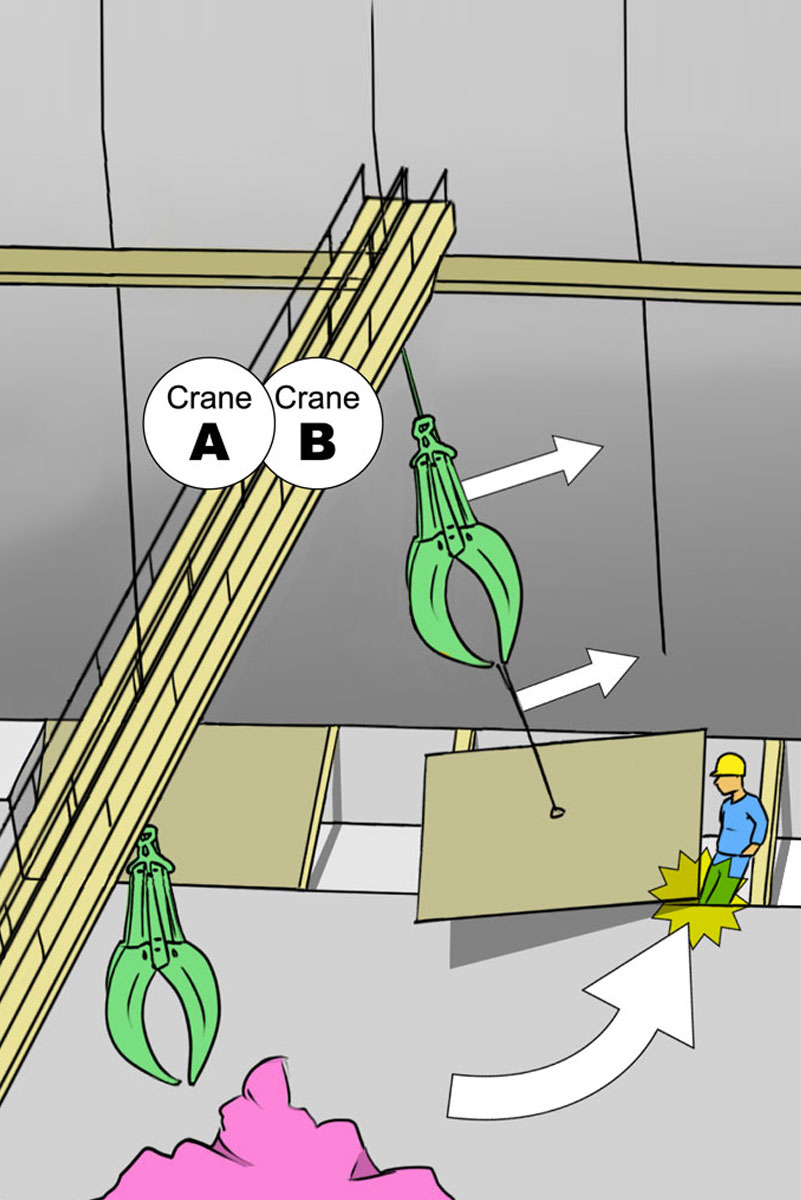
Crane A bumps into crane B and causes crane B’s steel plate to swing striking the client in the legs.
GRAPHIC #12
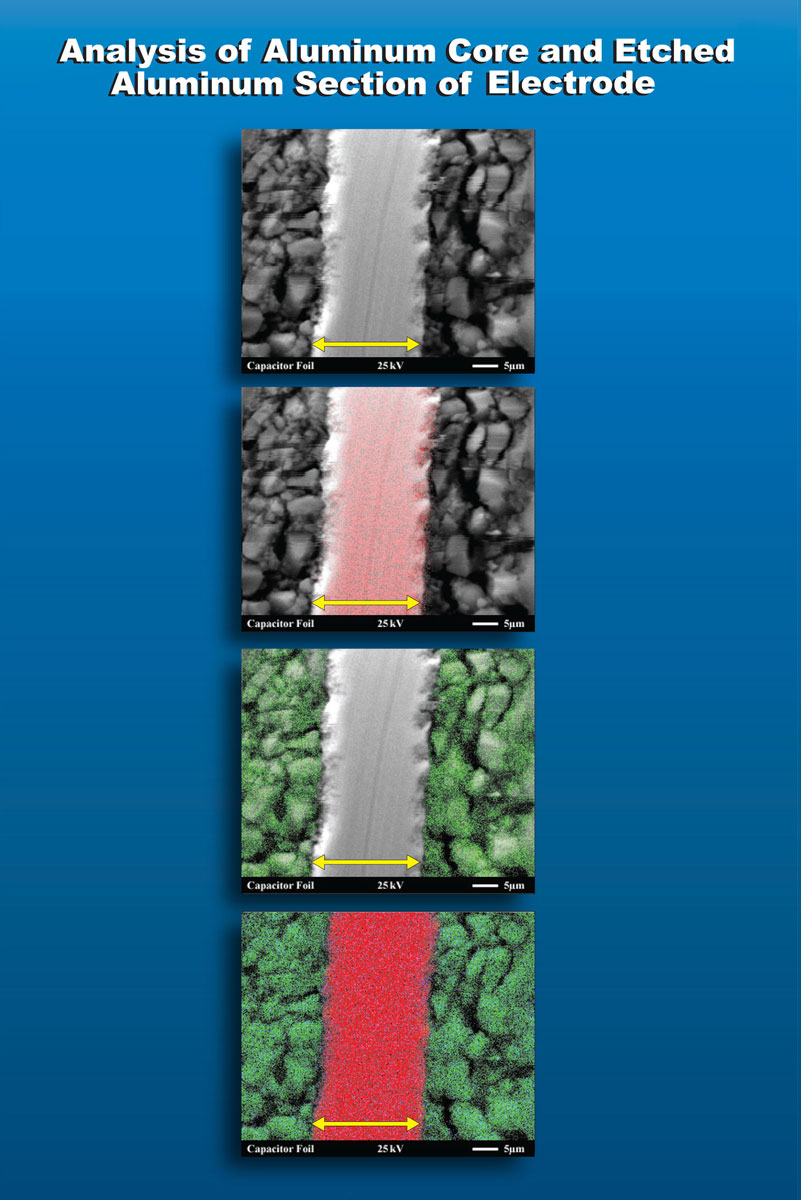
Electron microscope photographs clearly show carbon deposits caused by the slicing process.
GRAPHIC #11
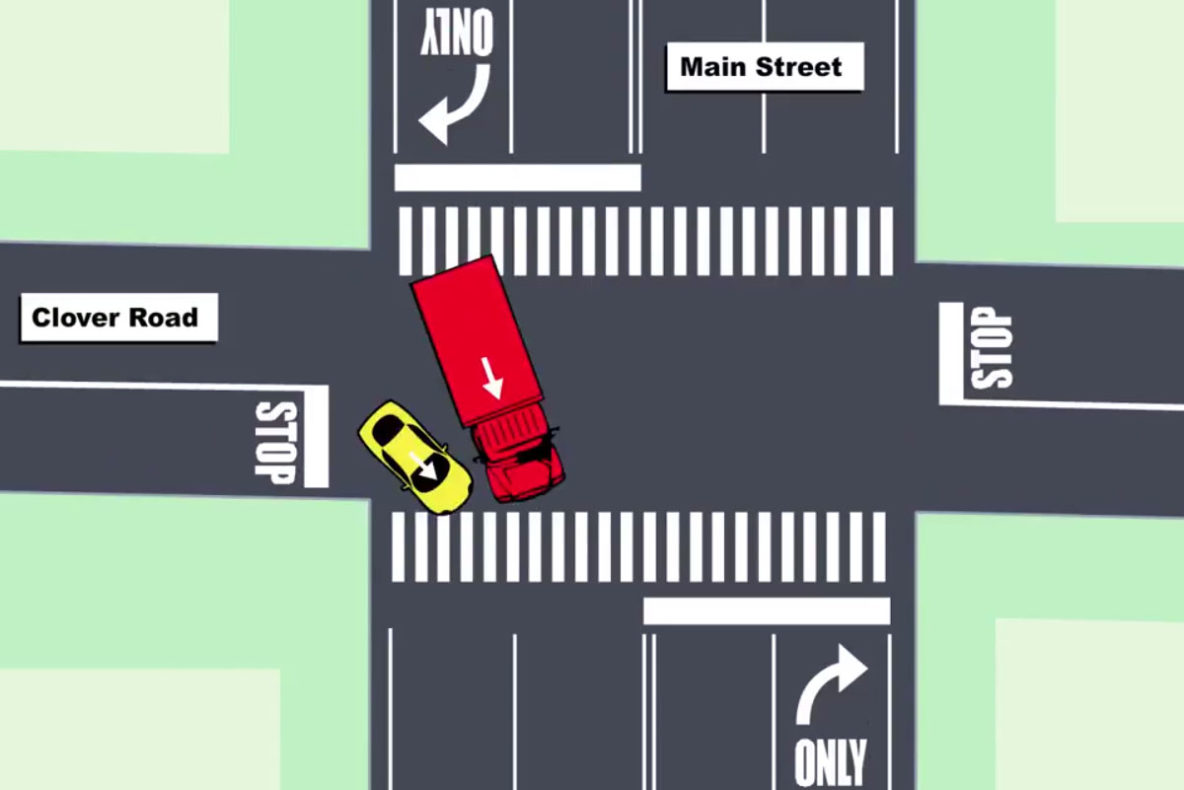
A truck driver ignores the “right turn only” lane and speeds into the path of the client’s car.
GRAPHIC #9
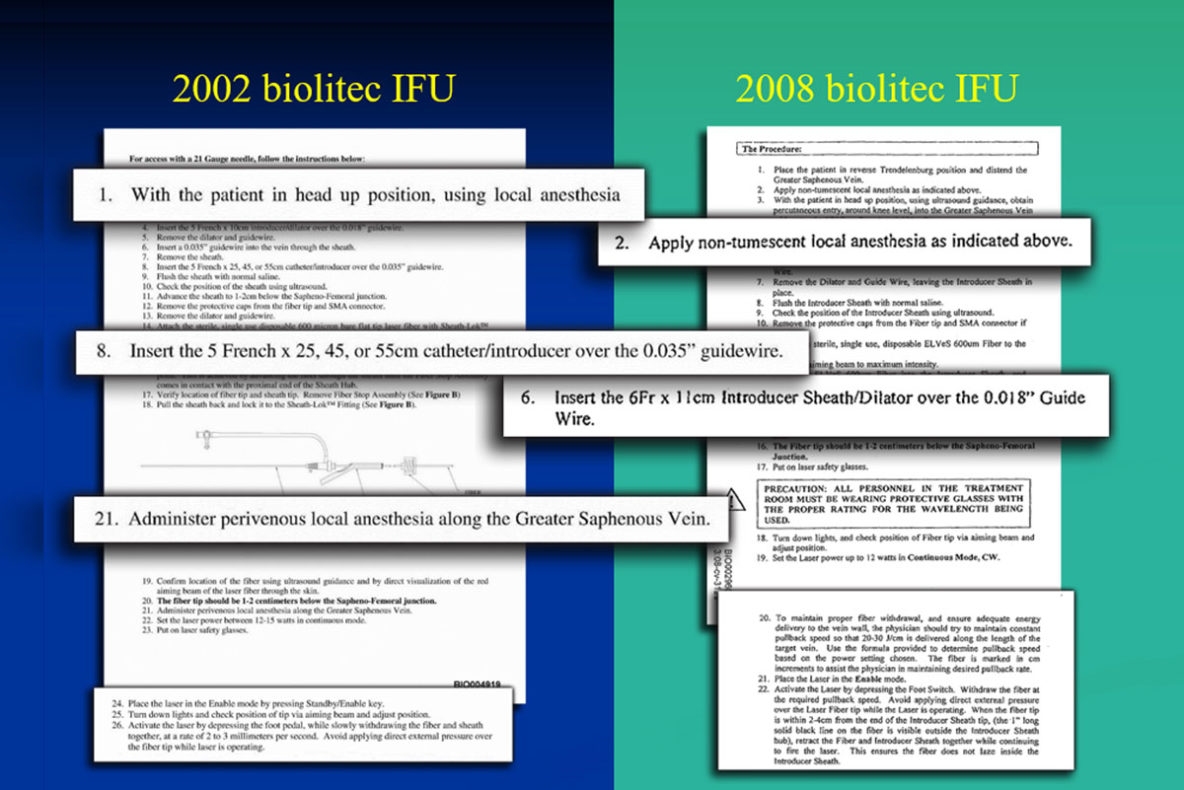
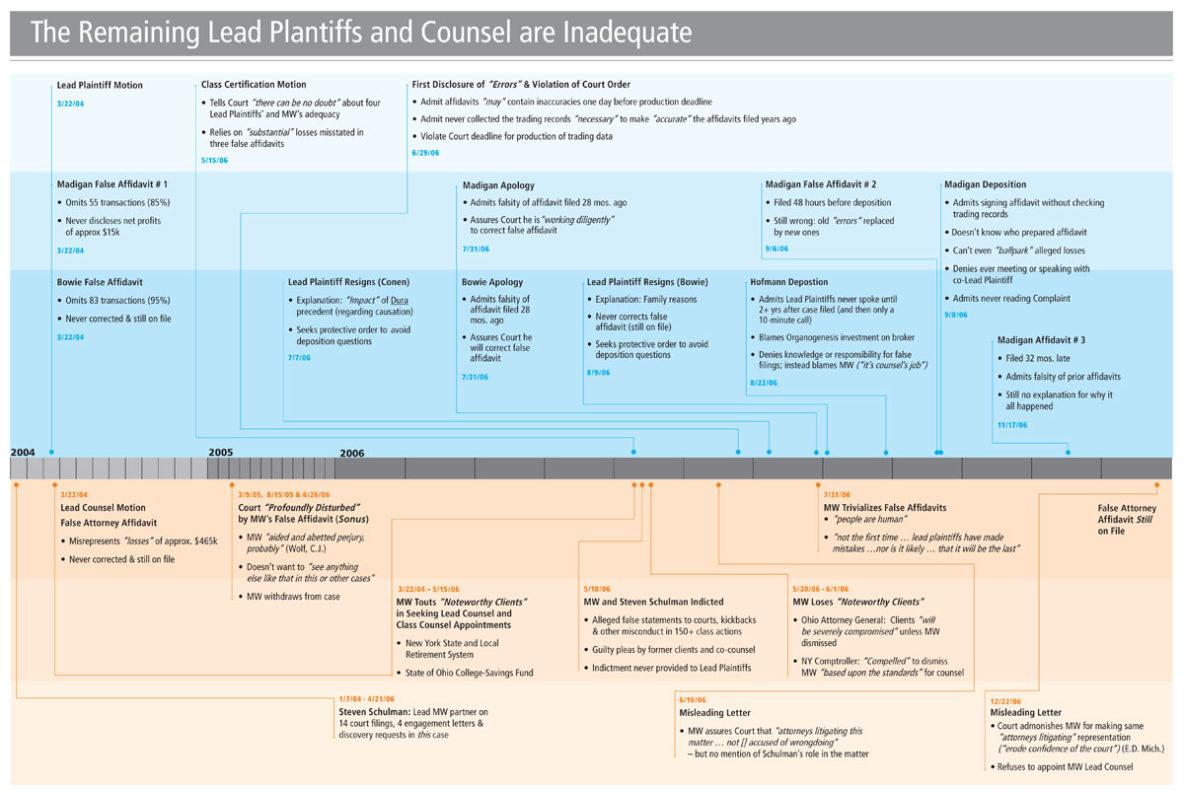
A PowerPoint build unveiling strategic point after strategic point extracted from two documents.
GRAPHIC #7
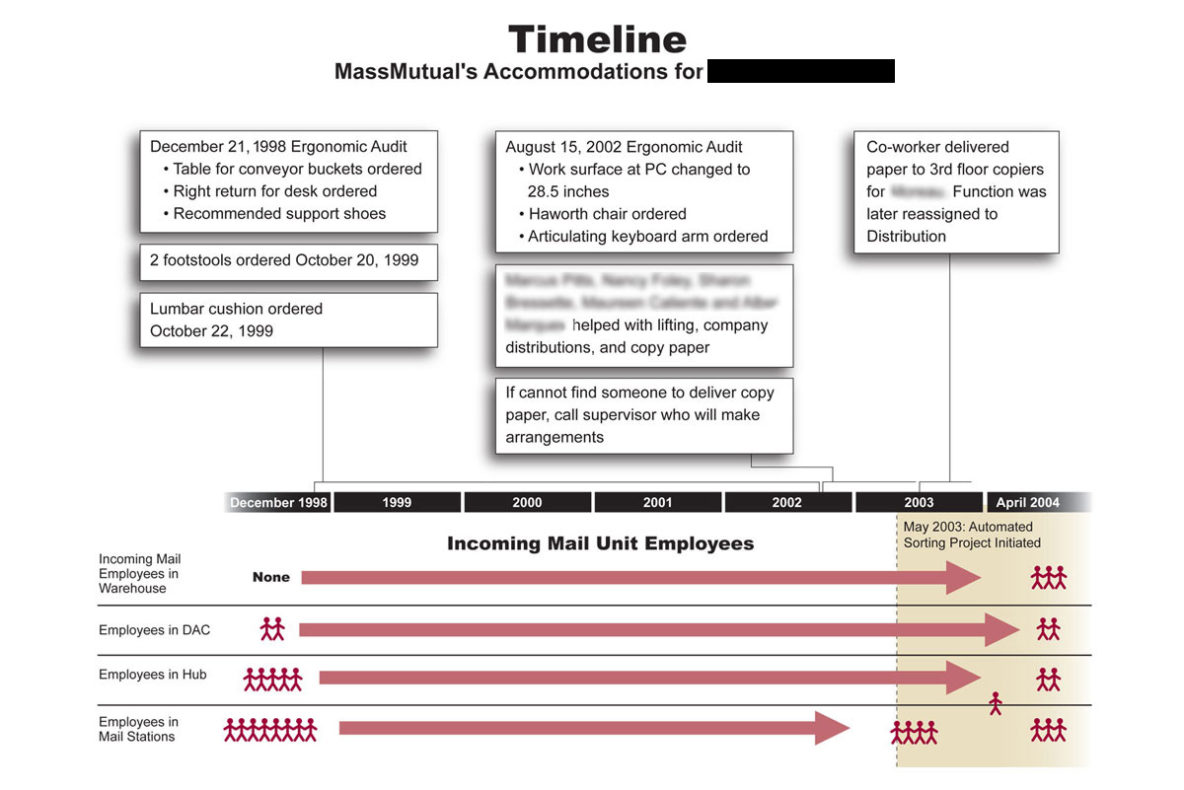
This graphic illustrates the efforts made by the employer accommodate an employee with a claimed disability.
GRAPHIC #6
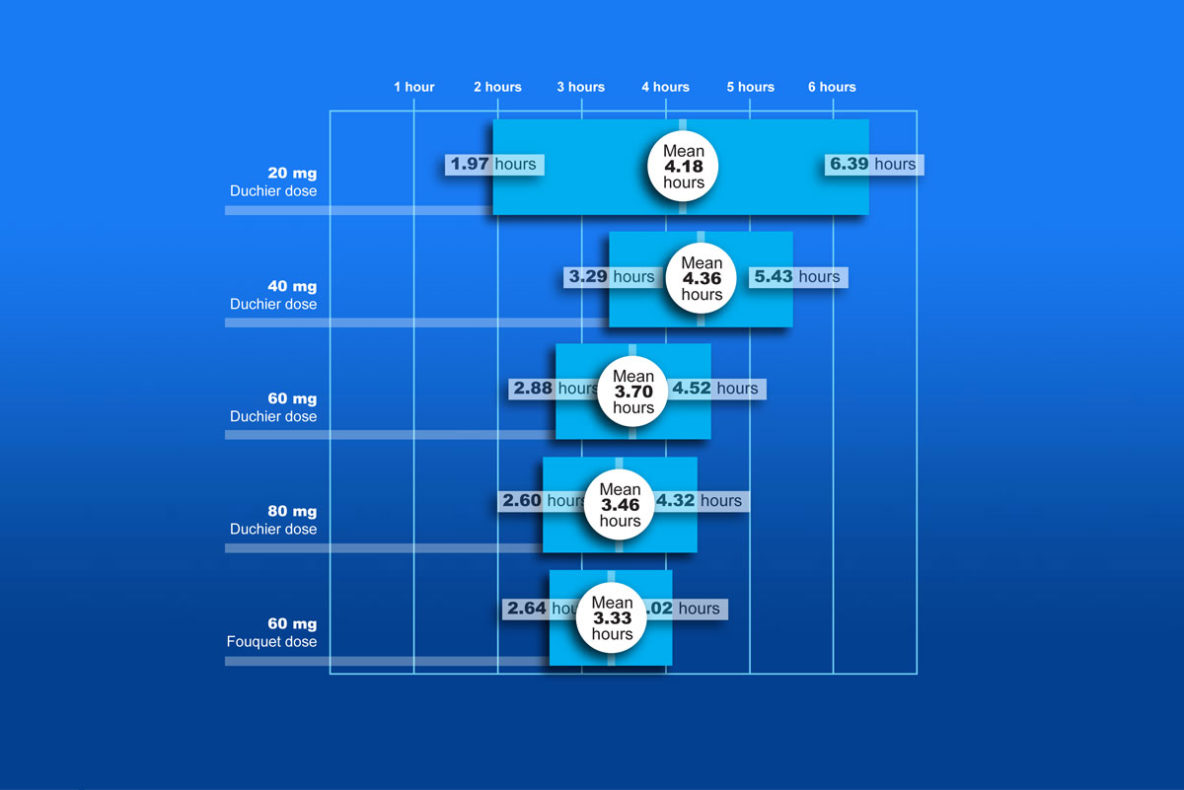
Once the mean similarities are placed along-side the dose and duration information, one can see the different contributing factors affecting the results.
GRAPHIC #5
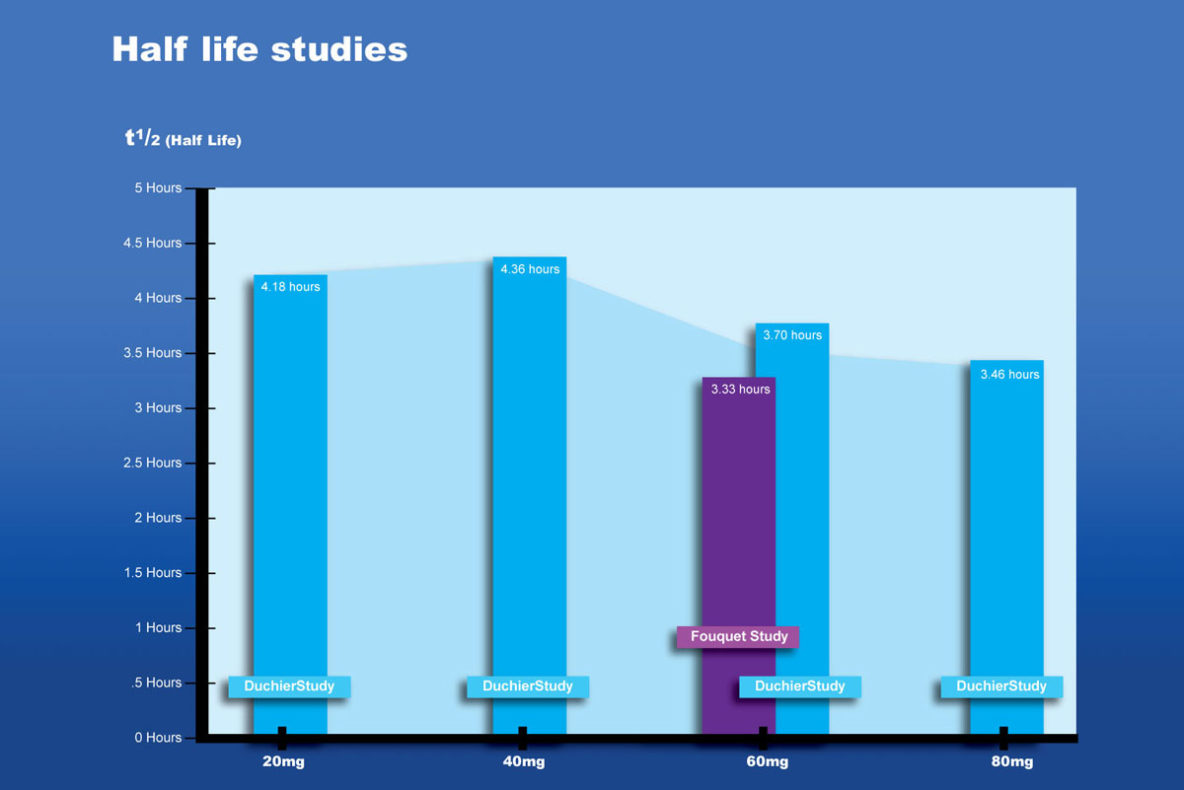
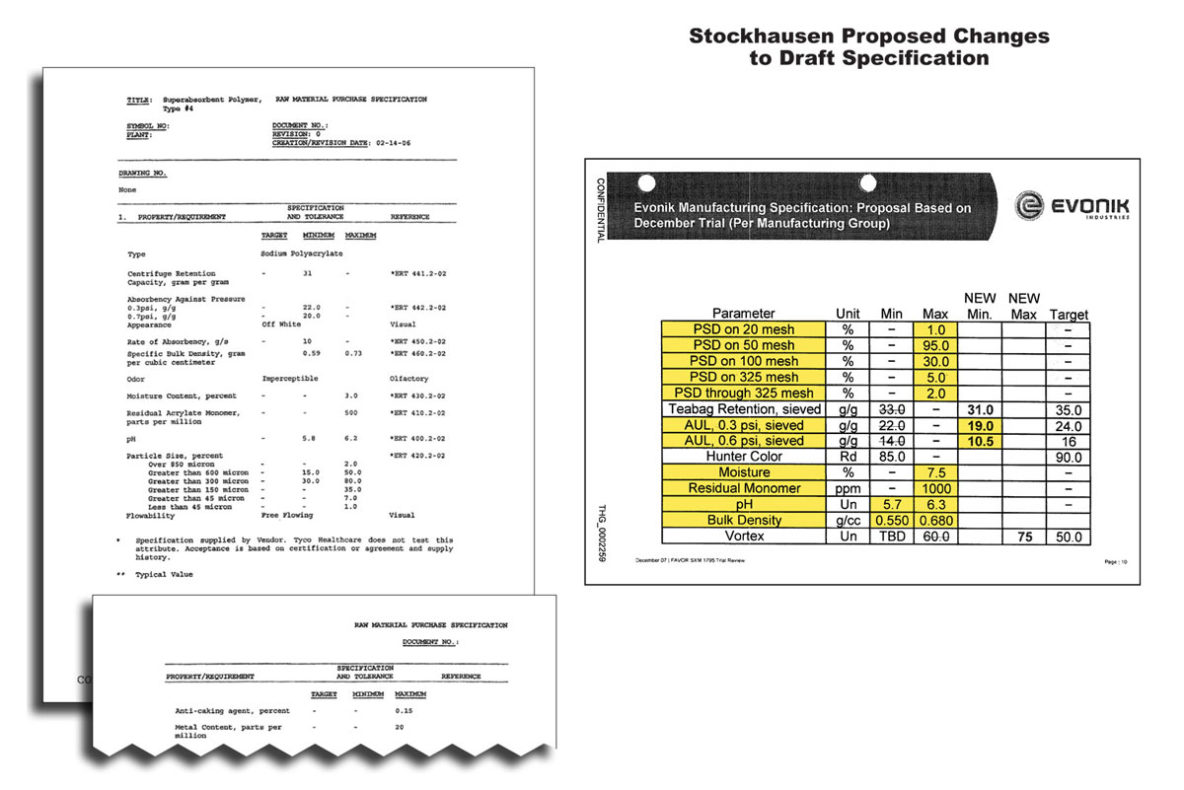
Similarities and exceptions become more obvious when the information is viewed from the correct angle.
GRAPHIC #4
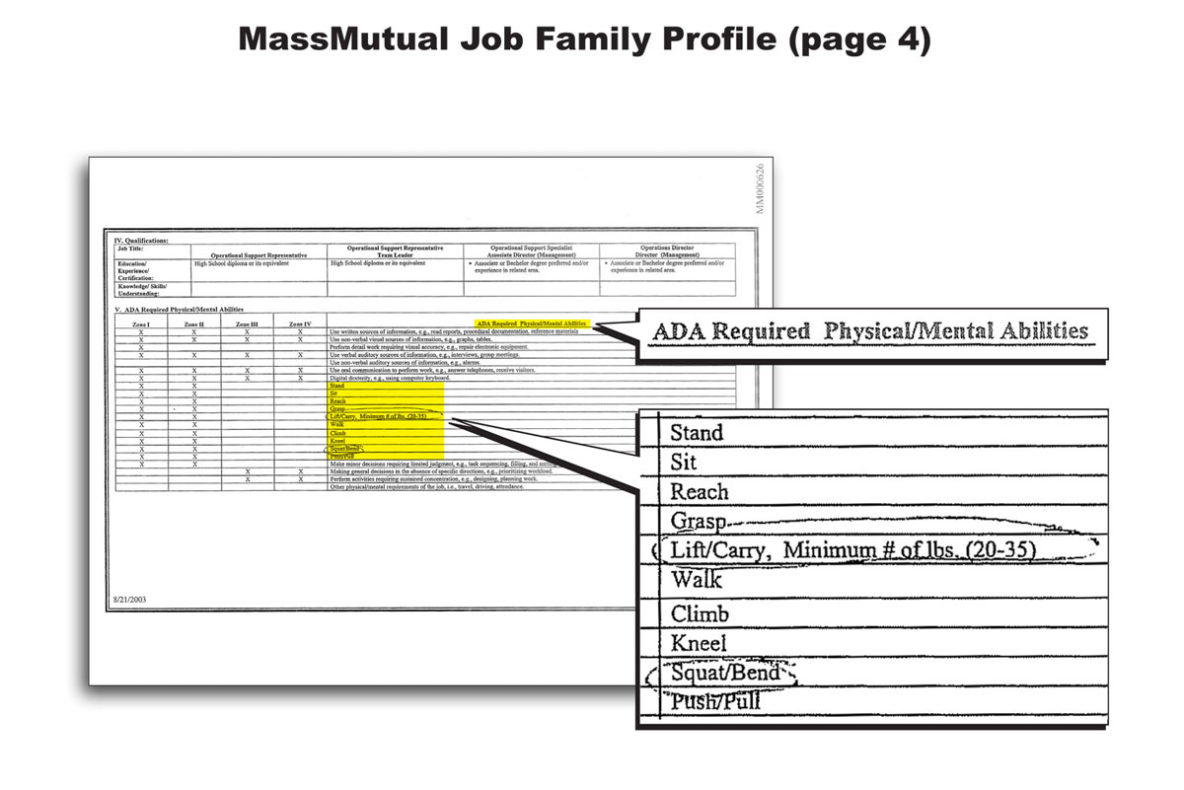
This illustration uses callouts to indicate essential responsibilities of the plaintiff’s job.